alevin's account talk

Another $USD chart. I've been using FreeStockCharts for awhile but only now signed up so could copy one of those charts to post. Monthly chart, note the pairs of vertical lines for each indicator-closest comparisons I can find between current chart indicators and historic.

View attachment 11097

I had no clue about market behavior patterns vs. currency back in the 90s. $ started climbing, and market went with it back then. can it happen again? I have a hard time believing. seems like this time is different-but is it?
 
So...gravestone doji on the SPX today. According to the rules, gravestone doji needs a gap up tomorrow or at least a close above today's close by EOD to confirm shortterm trend change. Birch will just say its all been a pause in the longterm secular bull of course.

I'm not willing to bet my hat on it going up a whole lot, but I'll hang in til Friday, maybe recoup some of what I've lost in the downturn lately. wonder what SS will say on Friday am? these sticky pants, hmm. might need a fresh pair soon.
 
Both Newt and Pawlenty are espousing reducing the capital gains and dividend tax from 15% to 0%. Can you imagine what the bull would do? We'll see if more come out with similar programs. I would certainly enjoy keeping all my gains and income.
 
Both Newt and Pawlenty are espousing reducing the capital gains and dividend tax from 15% to 0%. Can you imagine what the bull would do? We'll see if more come out with similar programs. I would certainly enjoy keeping all my gains and income.

So true, but they are 2 of many potentials, and that is assuming that anyone can beat BHO (you know he has >50% on the government dole and therefore voting for him)... :sick:
 
The information is now in the public domain and is part of the new hope and change we can count on. The market will eventually take notice.
 
The market is still noticing we haven't resolved the debt ceiling yet, Birch-see JTH's account talk this morning.

As for me, I am still learning how to spot short-term swings, rather than the intermediate ones I've tried to key on for quite awhile. Here's what I'm working on, now that I discovered FreeStockCharts. I think Jason pointed the way there. before that I'd been using only StockCharts and bigcharts, which don't have timeframes shorter than Day. I didn't act on the signal in the chart below, because I'm still learning to spot the shortterm signal these indicators give when considered together. But I'll act on the next similar signal when I see it. meanwhile, I'll be away from charts and keyboard for next week and half after today so prefer being out than in while unable to react to anything unforeseen major during that time. still have toe in with outside funds tho, just not in tsp at the moment. anyway, hourly chart for viewing pleasure-intended use-shortterm trades only.
 
Last edited by a moderator:
Back sometime during the last big downturn (aka cyclical bear market), I learned one of the best indicators for bear market is when 13 week EMA crosses 34 week EMA by 1% or more. Been watching all week. Cross was there as of Monday, difference has increased from .1% to .4% til tonight it stands at 0.787%.

I went in on a 1x short before work today, noted over on ETFtalk-first one I've attempted since the last cyclical bear. I've learned a lot since then, but certainly nowhere in JTH league. Still, thinking I might do a little better with the inverse ETF tactics this time around-I don't do leverage, don't have enough playdough for that. We're almost there, hang on tight, I might have been a little early but not by much.
 
If this wasn't "the" crash, I am more screwed than I thought...

We will be in new cyclical bear market (per the rule of thumb I cited last night), once the 13 week EMA is below 34 week EMA by 1% or more. Last night, the difference was .0787. We aren't in bear market-yet, according to this rule, but if the difference between the 2 EMAs gets to 1%, this rule will be confirming Sentiment Signal, which Tom said yesterday indicates we're in new bear market. The EMA rule hasn't confirmed yet, but we're very close.

I bought an inverse ETF yesterday in outside account (very small potatoes compared to TSP acct), because we're so close to entering new cyclical bear using the EMA rule and I could tell early how the day was going. If we were near the "bottom", I'd never have done that, even using 1x ETF.
 
Always insightful and willing to share. Thanks for your hard work and I miss our chats ! ;)

Favorite Berry bear, so good of you to stop by. :) I too have missed the chats. Glad you're back on the green side this week. very glad.

As far as Insightful? maybe-good at timely decisions? Not so much. too slow to pull the trigger to go long most times, so I haven't make much headway. better at preserving capital last few years. Hope to do better on the long side once I see start of next new cyclical bull (the one coming after this next cyclical bear is officially ended per EMA rule).
 
too slow to pull the trigger to go long most times,).

Time has left me more cautious as well. Preservation during 500 point drops in the Dow is not only wise, it's essential. I remember someone mentioning the S&P500 (if someone invested there money since 2008) ,,, they wouldn't be very pleased. Thats why friends don't let friends Buy & Hold. But hey, no sense preaching to the choir. Great being here ! ;)
 
Looks like todays close will contribute week 6 of the DeMark 9-count down on weekly count. I'm sitting out the next 3 weeks until/unless I see a DeMark trend change based on a weekly close higher than 4 weeks prior.

If we get to the end of the 9-count without the trend change, I'll be anticipating continued drop/sideways for many more weeks after that-especially if we reach 9-count down on weekly closes before we hit 1091 (current DeMark weekly support). Bear market per the weekly EMAs as of last week.

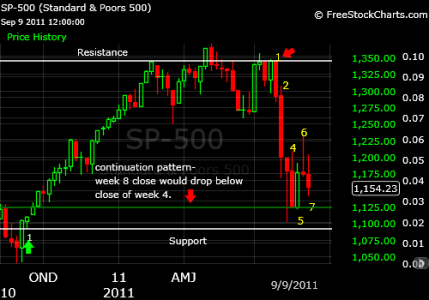
Update. looking like today makes week 7 of DeMark 9-week count Down (weekly close lower than weekly close 4 prior). Kept quiet all week, waiting to see, suspected would be lower by weeks end. If the pattern continues, next weeks close WILL be lower than 1123. I'll be very surprised if it's not. staying out til the water's much much shallower (most likely another 2 weeks minimum). I don't swim that well. will post a pic tonight.
 
Nice avatar! :D
Same to you! :D

Here's the chart I said I'd post tonight. shows support and resistance DeMark-style on weekly chart and where we are in the count-down relative to support and resistance levels in this system. I haven't figured out how to upload chart from javascript direct from Freestockcharts site-last time I tried, it uploaded an old chart I'd been playing with, not the one I thought I was uploading. Jason knows how to do it right, gonna have to ask for some help one of these days.

spx 9-9-11 weekly count-down.png
 
Back
Top