12 Month Simple Moving Average
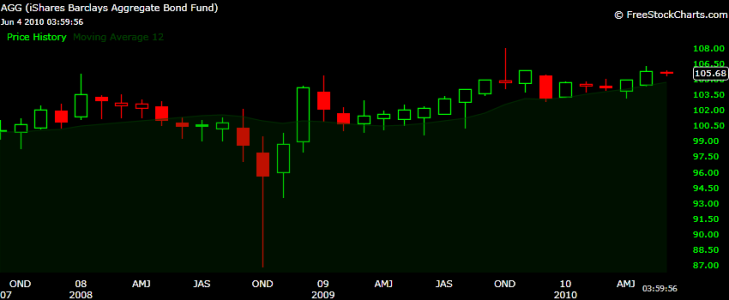
Some folks might consider it "old school" or too simplistic, but I beg to differ. The 12 month Simple Moving Average is a fairly accurate and reliable way to determine who is in control of prices. Could it really be this simple? To answer that question just look at these charts and ask yourself how much you would have saved back in 2007?
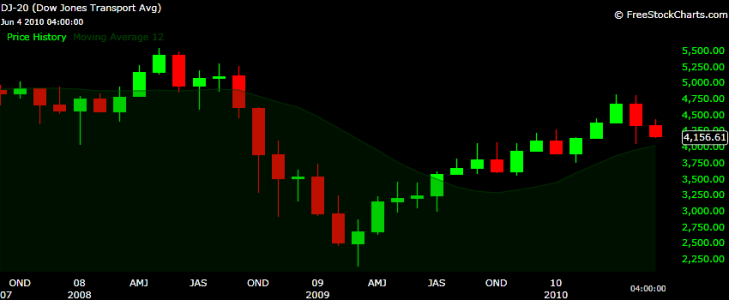
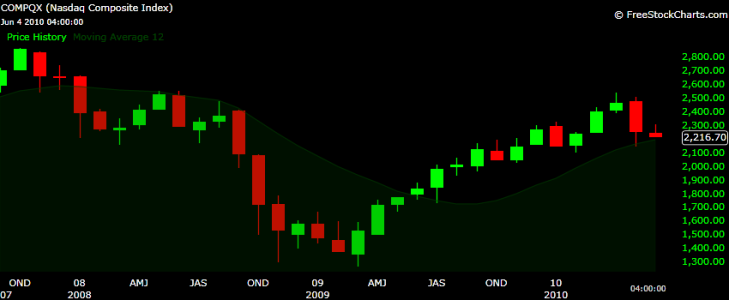
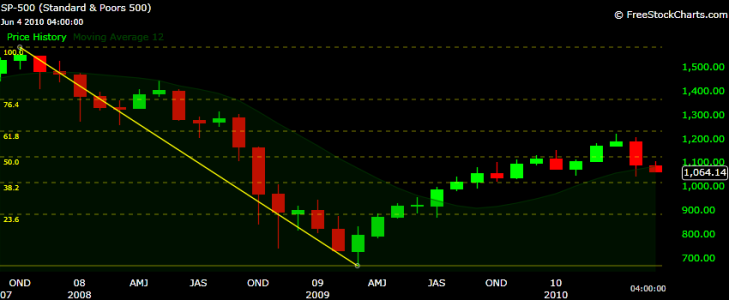
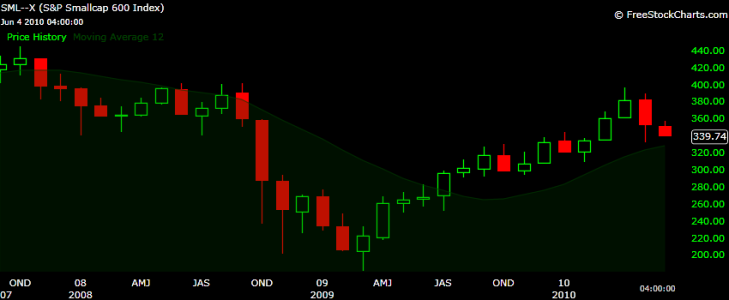
Right now my S&P 500 analysis tells me we have established a strong intermediate-long downtrend. I expect a break of of 1040, if that happens then I expect a quick test of 1032, I consider it important because it's the 500 day SMA. Afterwards, we test the 38.2% Fibonacci retracement at 1014 , and if that breaks we go to 950. With the increase in volatility I consider the short-term 50/200 MA Golden Crosses to be mixed and unreliably partly due to the IFT limitations within TSP.
In addition, I believe it's important for us to understand how long these severe Bear Market recoveries take to fully recover prices. For our newer readers I'll refer you to a previous blog I did called 2010: Bear Market Recoveries Bears take the elevator down. Bulls take the stairs up.
Lastly, thank you everyone for your kind words of support while I took a much needed sabbatical from the markets...Jason
