A Rare November: Bottom 5% Deviations Inside a Top-6% Trend
Part 2 of A Rare November: Gaps
Friday was an interesting statistical setup, across 20-Years of price action.
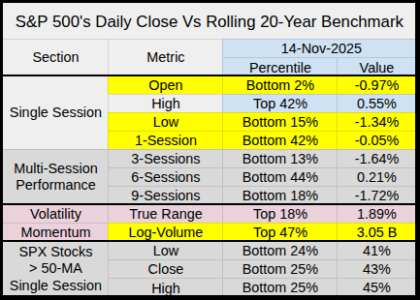
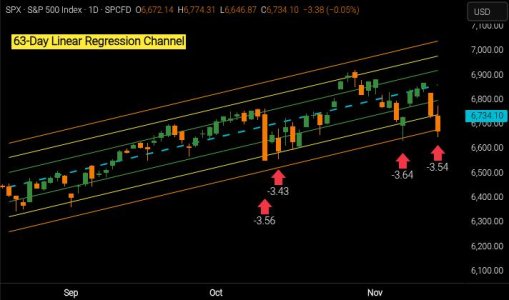
Add to this some interesting price action on the 63-Day Linear Regression Channel
From the 63-LR Channel, a Bottom 5% Deviation falls within the range of -2.95 to -7.68.

When the 63-LR slope is rising, a low deviation often reflects a seller’s flush, where prices should retrace back towards the trend.
If we think of a Bottom 5% Deviation as a measure of volatility, then when we sort these events by month, we can see (from 252 Bottom 5% gaps) November ranks low in the count list
Closing this out, the Bottom 5% Of Deviation Lows are designed to
Part 2 of A Rare November: Gaps
Friday was an interesting statistical setup, across 20-Years of price action.
- -0.97% Opening gap in the Bottom 2%
- -1.34% Session Low in the Bottom 15%
- All this and a flat -.05% close with normal volume

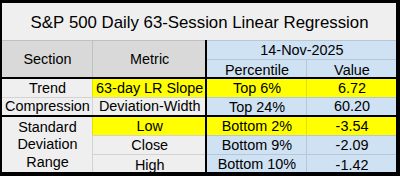
Add to this some interesting price action on the 63-Day Linear Regression Channel
- Within the context of the past 20 years.
- The Slope Angle remains strong, trending upward in the Top 6%
- Contrasted with a -3.54 Standard Deviation Low in the Bottom 2%

From the 63-LR Channel, a Bottom 5% Deviation falls within the range of -2.95 to -7.68.
- The 20-Year average is 12 Dev per year.
- 2025 has had 13, with 2 in November
- As expected, a low Dev has a low 33% single session win ratio but…
- Friday closed flat -.05% possibly giving us a reversal

When the 63-LR slope is rising, a low deviation often reflects a seller’s flush, where prices should retrace back towards the trend.
- It might look concerning to see we've had 4 of these events within the past 63 sessions.
- But the 20 year average is 3.11 per 63-sessions
- The max recorded was 20 during the Mar-Apr-2020 -35.41% Bear Market.

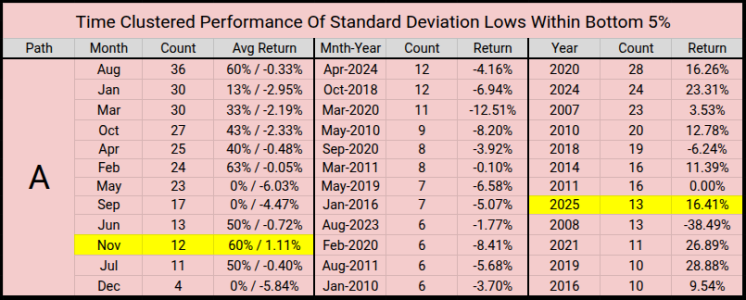
If we think of a Bottom 5% Deviation as a measure of volatility, then when we sort these events by month, we can see (from 252 Bottom 5% gaps) November ranks low in the count list
- November has a small count of 12 over the past 20 years
- Two from Nov-2025, ten from other Novembers.
- Those 10 have a monthly 60% Win Ratio and average 1.11% from 5 Monthly returns.
- Wrong: We've never had more than 2 in November per the past 20 years.
Correction: "Well that wasn't true, we had 3 in Nov-2007 which closed the month down -4.40%"

Closing this out, the Bottom 5% Of Deviation Lows are designed to
- Capture the worst 252 deviation lows (regardless of the slope's direction)
- From this Bottom 5% only 0.047% have occurred in November.
- That's 12 of 5,040 sessions
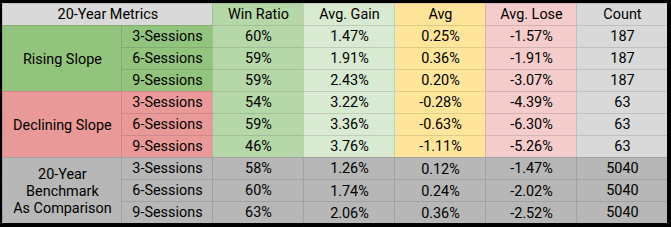
- Since the Slope Angle is in the Top 6% we can filter out the Bottom 5% gaps and take a look at 3-6-9 sessions forward of the gap.
- What we see is performance in a rising trend is stronger than a declining trend and stronger or on-par with the 20-Year unfiltered benchmark.

Last edited:
