12 Month Simple Moving Average

12 Month Simple Moving Average


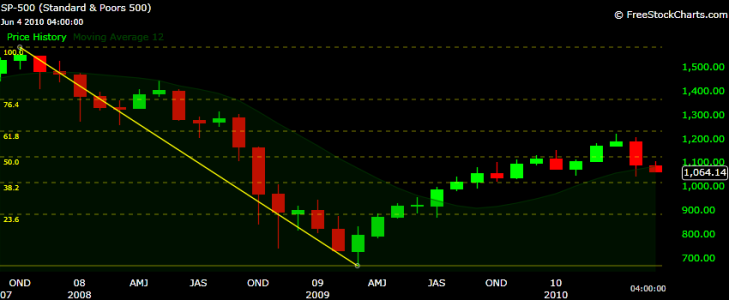
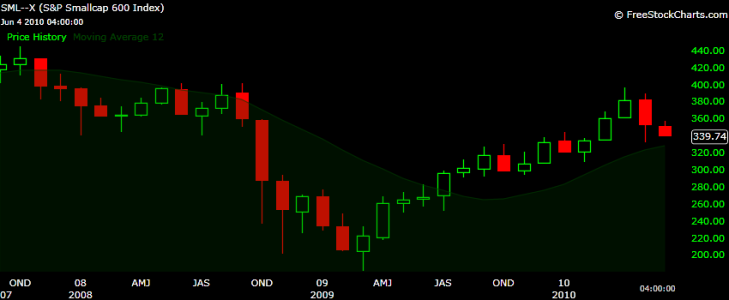
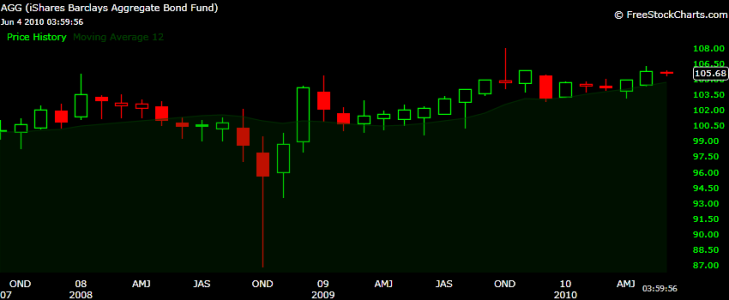
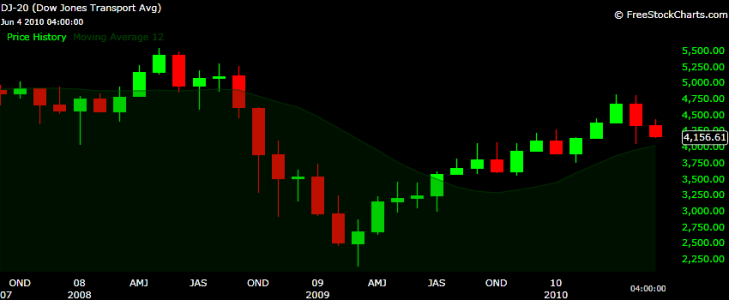
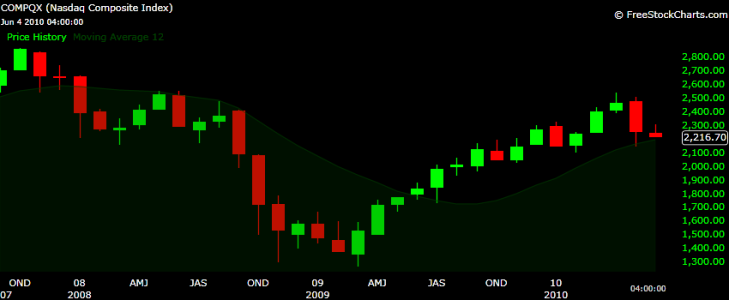
Some folks might consider it "old school" or too simplistic, but I beg to differ. The 12 month Simple Moving Average is a fairly accurate and reliable way to determine who is in control of prices. Could it really be this simple? To answer that question just look at these charts and ask yourself how much you would have saved back in 2007?
1.png

2.png

3.png

4.png

5.png

Right now my S&P 500 analysis tells me we have established a strong intermediate-long downtrend. I expect a break of of 1040, if that happens then I expect a quick test of 1032, I consider it important because it's the 500 day SMA. Afterwards, we test the 38.2% Fibonacci retracement at 1014 , and if that breaks we go to 950. With the increase in volatility I consider the short-term 50/200 MA Golden Crosses to be mixed and unreliably partly due to the IFT limitations within TSP.

In addition, I believe it's important for us to understand how long these severe Bear Market recoveries take to fully recover prices. For our newer readers I'll refer you to a previous blog I did called 2010: Bear Market Recoveries Bears take the elevator down. Bulls take the stairs up.

Lastly, thank you everyone for your kind words of support while I took a much needed sabbatical from the markets...Jason


JTH, I am not that familiar with your charting predictions. It is obvious from the chart that the market likely trends with the 12 day SMA. Why do you think we are headed down - is the 12 day SMA decreasing? Any help with this would be appreciated. Where do you find the 12 day SMA?
 
jkenjohnson;bt1553 said:
JTH, I am not that familiar with your charting predictions. It is obvious from the chart that the market likely trends with the 12 day SMA. Why do you think we are headed down - is the 12 day SMA decreasing? Any help with this would be appreciated. Where do you find the 12 day SMA?

These predictions are based on a break & close below the 1040 low made in May and the 1044 low made in February.. If that level breaks we will have estableshed a long-term lower low. Afterwards I look for key levels of support & resistance based on Fibonacci & key moving averages. While the 12 month SMAs are still rising it wouldn't take much for them to drift lower.
 
JTH, I really liked the EMA ribbons, cool...I would like to know your perspective on the S fund staying above the 200 ema and the C fund not being able to break it. I thought the C fund is a lagging Index. I am not sure if the the S fund or the C fund is leading either up or down
 
Cruzen;bt1559 said:
JTH, I really liked the EMA ribbons, cool...I would like to know your perspective on the S fund staying above the 200 ema and the C fund not being able to break it. I thought the C fund is a lagging Index. I am not sure if the the S fund or the C fund is leading either up or down

I try to look at the Transports, NASDAQ, S&P 500 & S&P 600 small caps as a group, each being co-dependent on each other. The S-Fund had been outperforming the C-Fund, so it was overbought trading higher above the key moving averages. Any one of these 4 indexes trading below its 200 MA should be a caution light. If we look at the 2007 Bear Market we can see the Transports gave us the first warning sign, followed by the S&P 500. Truth is any one of these 4 indexes could lead us back up, the key would be when that single index gets confirmation from one of the other 3. If I had to gander a guess, I'd say to watch the transports, they have a tendency to lead the markets
 
Thanks JTH. I am new to this site, and I have found your topics really interesting, please keep posting.
 
Cruzen;bt1572 said:
Thanks JTH. I am new to this site, and I have found your topics really interesting, please keep posting.

Thanks, and you're more than welcome, I do enjoy blogging, it keeps me sharper...Jason
 
Back
Top