wht00ss
Honorary Hall of Fame Member
- Reaction score
- 9
maybe something of interest to some.
(5/5/07)
To start things off this weekend here is a remarkable statistic going back to the early 1940's. If we look at the yearly returns of the Dow going back to 1900 there is a remarkable pattern that has occurred since 1943. Every year that has followed a Mid Term Election Year since 1943 has seen a positive return in the Dow as shown in the table below. The average return in the Dow during that time for the year following a Mid Term Election Year has been an amazing 15.7%. However prior to 1943 there was a mix of up and down years for the Dow following a Mid Term Election Year. The question is why has the Dow been up every year since 1943 following a Mid Term Election Year? Is this just a coincidence or is there a reason why this pattern has continued intact since World War II? Meanwhile if this pattern continues then 2007 should end up being a positive year for the Dow and based on what has occurred so far it appears this pattern may pan out once again.
As far as the major averages nothing has changed as overbought has become even more overbought. Pullbacks so far have been very minor and only only lasted a few days. Eventually we are going to see a more substantial pullback occur at some point as the market rarely if ever moves up in a straight line. Meanwhile as mentioned last weekend the S&P 500 is now at a level not seen since 2000 when it peaked on March 24 of that year with a closing high of 1527.
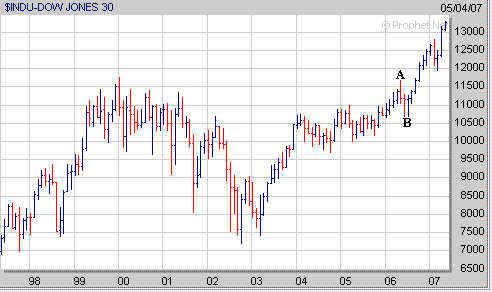
Furthermore as we saw in 2006 when the Dow got close to its previous high that occurred in the early part of 2000 this was followed by a pullback during the months of May and June (points A to B). Thus it wouldn't be much of a surprise if the S&P 500 undergoes a similar pullback as well since it's getting close to its all time closing high.

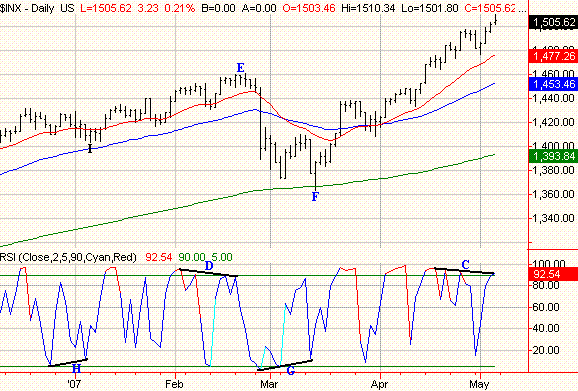
Finally another thing that is occurring with the S&P 500 is that its Relative Strength Index (RSI) has been trending downward (point C) as it has been making new highs of late. We also saw the same type of pattern develop in February as the S&P 500 made new 52 weeks highs but the RSI was trending downward (point D) which was eventually followed by a sharp 3 week correction in the S&P 500 (points E to F). Of course this doesn't mean a sell off of that magnitude is going to occur again however it does mean we could be nearing a pullback which may last more than just a few days.
Meanwhile also notice in the chart below trends in the RSI can be used to help define a bottom as well. Notice back in March how the RSI began to trend upward (point G) as the S&P 500 made a lower low in mid March which was followed by a strong rally. We also saw the same trend in the early part of 2007 as the RSI was trending upward (point H) as the S&P 500 was nearing a bottom which was then followed by a rally from mid January through mid February (points I to E).

Last edited:
