Uptrend's Account Talk

Hey Uptrend.. Also consider I vs S, say, referenced to 7/1, down by about 1.5 % more, so more spring-back potential, I think...

Polarbear: I think you are right; as I have been watching. Will have some TA before the open Monday on the EFA ETF that I use to track the I fund. Thanks for stopping by.
 
Monday was quite the day! Pretty good drop. SPX and Whilshire 4500 (representing the C and S funds) came right to the 61.8% fibonacci, which is the retracement from the last up-wave. This is the bulls last stand. There was an intra-day elliot wave overlap (violation) on SPX, but not the DOW. Rabbit trade is still on, but it entered too early. Target exit is still by this Friday or early next week.

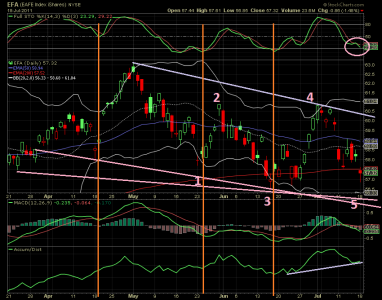
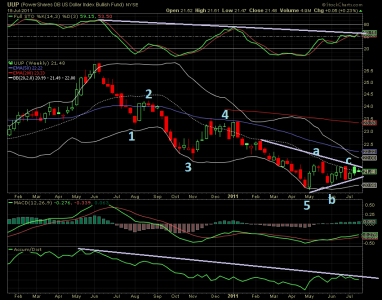
Now a look at EFA for the I fund. When you look at EFA, you also need to look at the US dollar. Here are the charts:

I still think we may be in the 5th wave down as shown on the EFA chart (daily). Based on wave symmetry, bollinger bands, support and such, I think it still has a little ways to fall before the turn-around. Probably 1-3 days or so. However, there is a positive slope on accumulation, and it sits on the 61.8% retracement today based on the last wave. On to the UUP or US dollar bullish fund (weekly). The 5th wave down was completed by the first of May and a very weak abc mini-uptrend developed. But really! We see a wedge that has formed, so a big move will happen soon - IMO a breakdown. Why? We see a long-term negative slope on Accum/Dist and a negative divergence on the stochastic. So yeah, I think a I trade may be in the cards as soon as the bleeding stops.

EFA_7_18_11.pngUUP_7_18_11.png
 
Rabbit is buying the I Fund. Cheers

[TABLE="width: 388"]
[TR]
[TD="class: xl72, width: 132, bgcolor: #e6b8b7, colspan: 2"]Rabbit Trades
[/TD]
[TD="class: xl65, width: 64, bgcolor: #e6b8b7"][/TD]
[TD="class: xl73, width: 128, bgcolor: #c5d9f1, colspan: 2"]Debut '7/11/11
[/TD]
[TD="class: xl74, width: 64, bgcolor: #c5d9f1"][/TD]
[/TR]
[TR]
[TD="class: xl77, bgcolor: #bfbfbf"]My IFT
[/TD]
[TD="class: xl66, bgcolor: #92d050"]Buy
[/TD]
[TD="class: xl75, bgcolor: #00b0f0"]Fund
[/TD]
[TD="class: xl67, bgcolor: red"]Sell
[/TD]
[TD="class: xl68, bgcolor: yellow"]+/- %
[/TD]
[TD="class: xl76, bgcolor: #da9694"]Exposure
[/TD]
[/TR]
[TR]
[TD="class: xl69, bgcolor: transparent"]July-1
[/TD]
[TD="class: xl70, bgcolor: transparent"]7/11/11
[/TD]
[TD="class: xl69, bgcolor: transparent"]C, S
[/TD]
[TD="class: xl69, bgcolor: transparent"][/TD]
[TD="class: xl69, bgcolor: transparent"][/TD]
[TD="class: xl69, bgcolor: transparent"][/TD]
[/TR]
[TR]
[TD="class: xl69, bgcolor: transparent"]X
[/TD]
[TD="class: xl70, bgcolor: transparent"]7/20/11
[/TD]
[TD="class: xl69, bgcolor: transparent"]I
[/TD]
[TD="class: xl69, bgcolor: transparent"][/TD]
[TD="class: xl69, bgcolor: transparent"][/TD]
[TD="class: xl69, bgcolor: transparent"][/TD]
[/TR]
[TR]
[TD="class: xl78, bgcolor: transparent, colspan: 4"]My IFT shows my entry and monthly trade number.
[/TD]
[TD="class: xl79, bgcolor: transparent"][/TD]
[TD="class: xl80, bgcolor: transparent"][/TD]
[/TR]
[TR]
[TD="class: xl81, bgcolor: transparent, colspan: 5"]X means I did not shift allocation on a new trade signal.
[/TD]
[TD="class: xl83, bgcolor: transparent"][/TD]
[/TR]
[TR]
[TD="class: xl84, bgcolor: transparent, colspan: 3"]Exposure is number of trade days.
[/TD]
[TD="class: xl85, bgcolor: transparent"][/TD]
[TD="class: xl85, bgcolor: transparent"][/TD]
[TD="class: xl86, bgcolor: transparent"][/TD]
[/TR]
[/TABLE]
 
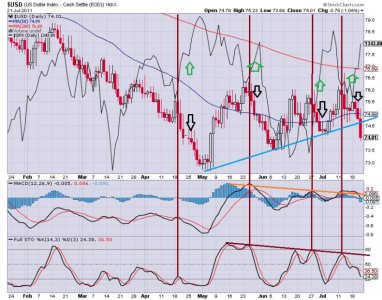
Just in case you don't believe that the US dollar and equities (in this case SPX) are related, please look at this chart:
The candles are the US dollar and the wavy line is the SPX. Notice the green arrows where SPX is rising, and the black arrows where the USD is falling. Also notice that the USD broke down below a rising triangle today (rising blue line forming the bottom part of the triaangle -I just dont have the horizontal top drawn a little above 76). Rising triangles are bullish - but not now with the breakdown. Also notice the negative slope on the MACD histograms and the stochastic. So for the short term, this will help the I fund, as a weak dollar will give a little more punch to any gain. Big gain today with a +1.72%.

If Congress can't act over raising the debt ceiling, the market may scare and sell-off next week. Stupid contrived crisis. I was thinking about reducing my position 50% tomorrow, even if the indicators don't flip to a sell. The indicators can't see this trouble, yet, at least I don't see them there.

Did anyone else notice that the large caps were leading the small caps today?

USD_SPX_7_21_11.jpg
 
I have know intention of selling on a down swing however I am of the same mind set as you. Might reduce mine to 50% as well until the clouds dissipate.
 
Weekly Employment Report:

Atlantis Space Shuttle Program ends: -1500 workers
RIM (blackberry) -2000 workers
Borders closing -10700 workers
CISCO Systems -6500 workers
Goldman Sachs -1000 workers


Hmm thats 21,700 jobs lost in a week or about one million annual pace. Economy soft spot or sinkhole? Less money in the economy = less consumer spending = stall speed approaching = Oh NO!
 
44 million on food stamps = buy WMK. And by the way the recently unemployed now qualify for three years of unemployment compensation. Where's the incentive.
 
Thanks for the info.

It is in my signature line, when a change occurs. The sell was triggered today. Most times the sell will be triggered with yesterday close (daily timeframe) TA. This sell, however, was triggered this AM, but in time for an IFT. Cheers.
 
Seems like market is in a holding pattern. If Spx 1331 breaks, then 1313, 1303, and then 1291. If the gov plan to raise the debt ceiling does not include enough cuts then AAA rating will probably be lost in 3 to 6 months. And a 10 to 15% decline in the market. Just thinking.
 
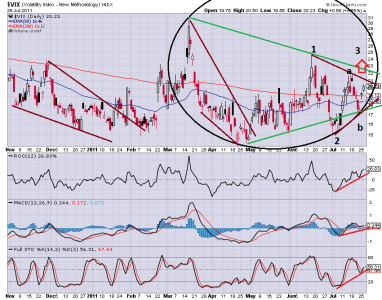
A look at the VIX. A rare pattern inside a circle/oval. A bullish falling wedge in March-May and a series of higher lows since the breakout in a contracting wedge. The wave count, ROC, MACD and STO suggest up. But I have been wrong before.


VIX_7_26_11.png
 
Caution. No turning points yet. Might be a weak dead cat bounce. All internals I am lookiing at are pointing down. I think the first target might be the SPX 200 ema coming in around 1275. Then perhaps a retest of the June lows near 1258. Then we will see about the H&S pattern with a target of around SPX 1170. August is always pretty weak, so this is not out of the question.

Circus in Washington continues. All clowns. Leaves me wondering whether our August federal paychecks will be on time, as it appears we are at the bottom of the pile of bills. If the US gov ran a household it might be like this: deciding not to make a payment on a new refrigerator that is two months late, and delaying one payment on the car, leaves just enough to make a down payment on a new TV. Insane.

The VIX did break up today, with a massive equities sell-off. Might challenge the June highs soon. The fear should continue, but the options put/call ratio is turning nuetral to a little bullish. This is a contrarian indicator. Someone will get crushed. Probably the little guy.
 
Market stalls beneath SPX 1313 major resistance. This is a backtest and that is all. Jobs unemployment report is still way too high. Possible AA US bond rating good for dollar? Theory is out there.
 
SPX, EFA and Whilshire 4500 all bouncing off their 200 sma. Even though this is a little bounce, it might not have staying power and is a dangerous play for market entry. We need to see a side ways move here and the debt ceiling issue resolved. Market is very oversold, but it can just stay that way as prices keep falling. In short the momentum is still down. All the revised down GDP numbers might take a toll on the market, or perhaps they are baked in now. One support after another is getting bashed and knocked out: SPX 1331, 1313, 1300, 1291, pretty severe action for one week. This is a SPX 62 point drop (4.6%), but still a higher low after the June low. Are we just getting started or are we finished? We should know soon.
 
Euphoria or Despair?

So August 1 is upon us, and many of us now have 2 TSP trades in our pocket. Or really only one if you are now on the sidelines like me. So POUS Obama tonight has announced a deal on the debt ceiling. Thats great!!! and the futures are rallying hard. But wait a minute, the house and senate have not voted on it and you know how that could go. The first 9 trading days in August have been, on average, very weak in the last twenty years. And consider that the market dropped more than 4% last week, so we are assured that there could be a pretty good bounce, and then either a retest of the low or more downside. I prefer the latter, but I will just have to watch like everyone else and see what happens. Take into account the weak GDP, and continuing job losses, and I don't see how that will help matters. For TA, the SPX 1313 will be formidable resistance. My thinking is that a turn away may be in the cards by Tuesday.

Still itching to use the trade in your pocket? I guess if you are in and plan to sell tomorrow or Tuesday, that might be ok. But remember, TSP is not a typical trading account, because the nearest stops are only in the daily timeframe. No automatic sells when a certian retracement level has been reached. I know this makes the hedge funds happy, and probably banks like JPM too.

The market is oversold, and will bounce. That is a given. But will this rally be like a 4th of July rocket that fizzles just after take-off? My system shows no safe entry at this time for TSP trading actions in the daily timeframe. Cheers.
 
Completely agree, Uptrend. I decided to stay in over the weekend, but am seriously considering exiting sometime this week if we get any kind of a bounce. These proposed spending cuts fly in the face of a a still languishing economy. Even with Bush tax cuts, interest rates near zero, and QEs, the private sector isn't creating jobs. There's really not much more DC can do to help the unemployment problem, businesses need to take advantage of these incentives and create some jobs. It's very difficult to see a silver lining going forward, and I'm not sure how we'll avoid a double dip recession with this agreement.
 
Back
Top