Uptrend's Account Talk

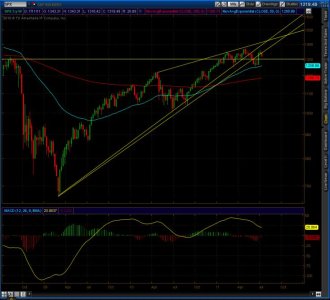
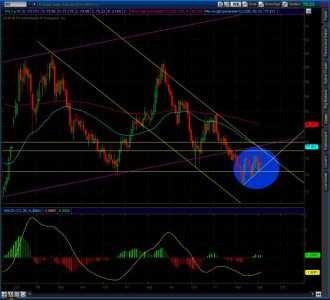
Well, I have not posted in a while, but I am still trading and following the markets. We either have had a period of consolidation in May and more upside will be at hand, or it is a harbinger of more serious weakness to come. Sentiment is now on the bearish side, so that should propel the upside for a few days. All of my TA says that an uptrend may be forming. The US dollar has had a clear breakdown, and should retest the lows by about June 23. I assume the I fund should remain strong through this time. Bond prices (AGG) show no weakness from the upward march from April 11. The VIX is a little worrisome. In my view, hold all active funds at this time (C S I F).
 
What a drop! Makes you want to sell! But, what do the trends say?

S Fund
Daily Nuetral Bias Bullish
Weekly Uptrend Bias Bullish

C Fund
Daily Nuetral Bias Bullish
Weekly Uptrend Bias Bullish

I Fund
Daily Nuetral Bias Bullish
Weekly Downtrend Bias Bearish

F Fund
Daily Uptrend Bias Bullish
Weekly Uptrend Bias Bullish

Just my 0.02. Holding for now. Stop loss would be below SPX 1303
 
System update today with stops. All stops given in the daily timeframe.

S Fund
Daily Nuetral Bias Bullish
Weekly Uptrend Bias Bullish
Stop loss would be below Wilshire 4500 694

C Fund
Daily Nuetral Bias Bearish
Weekly Uptrend Bias Bullish
Stop loss would be below SPX 1303

I Fund
Daily Nuetral Bias Bullish
Weekly Nuetral Bias Bearish
Stop loss would be below EAFE Index 59.60

F Fund
Daily Uptrend Bias Bullish
Weekly Uptrend Bias Bullish
Stop loss would be below Barclays Bond Fund AGG 106.96

 
System update today with stops. All stops given in the daily timeframe.

S Fund
Daily DowntrendBias Bearish
Weekly Nuetral Bias Bullish
Sell

C Fund
Daily DowntrendBias Bearish
Weekly Nuetral Bias Bullish
Sell

I Fund
Daily Nuetral Bias Trendless
Weekly Nuetral Bias Bearish
Stop loss would be below EAFE Index 59.60

F Fund
Daily Uptrend Bias Bullish
Weekly Uptrend Bias Bullish
Stop loss would be below Barclays Bond Fund AGG 106.96


System update today with stops. All stops given in the daily timeframe.
S Fund
Daily Downtrend Bias Bearish
Weekly Downtrend Bias Nuetral

Sell

C Fund
Daily Downtrend Bias Bearish
Weekly Downtrend Bias Bearish
Sell

I Fund
Daily Trendless Bias Nuetral
Weekly Trendless Bias Bearish
Stop loss would be below EAFE Index 59.60

F Fund
Daily Uptrend Bias Bullish
Weekly Uptrend Bias Bullish
Stop loss would be below Barclays Bond Fund AGG 106.96

Nuetral bias means that the fund is in a trading range.


System update today with stops. All stops given in the daily timeframe.
S Fund
Daily Downtrend Bias Bearish
Weekly Downtrend Bias Nuetral

Sell -Wait

C Fund
Daily Downtrend Bias Bearish
Weekly Downtrend Bias Bearish
Sell - Wait

I Fund
Daily Trendless Bias Nuetral
Weekly Trendless Bias Nuetral
Stop loss would be below EAFE Index 59.56

F Fund
Daily Uptrend Bias Bullish
Weekly Uptrend Bias Bullish
Stop loss would be below Barclays Bond Fund AGG 106.67

Nuetral bias means that the fund is in a trading range.

 
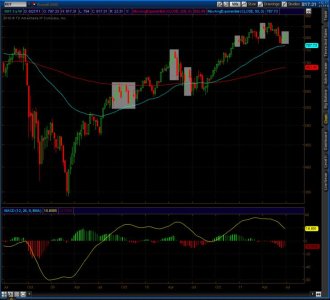
Weeks ups and downs often go in pairs as viewed on the Russell chart (weekly). Friday may be the sell day as it ends the first part of a 2 week up move. There is further risk of a 2 week down move as shown in preceeding grey boxes. It does not always happen. At any rate, there is upside resistance, at 1315 area on SPX. Will start posting system results soon. Just returned from vacation.

SPX_6_28.jpg
 
System update today.
S Fund
Daily Uptrend Bias Bullish
Weekly Uptrend
Bias Bullish
Hold

C Fund
Daily Uptrend Bias
Bullish
Weekly Trendless Bias Neutral
Hold

I Fund

Daily Trendless Bias Neutral
Weekly Trendless Bias Neutral
Wait

F Fund

Daily
Downtrend Bias Neutral
Weekly
Trendless Bias
Neutral
Wait

Neutral bias means that the fund is in a trading range.

Thanks Uptrend
 
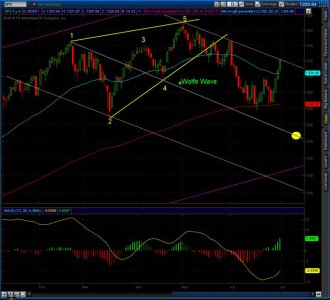
Ok the market is looking great right? Then why are: 1) new unemployment claims averaging 426k for the last 12 weeks?, 2) 20% of all homes underwater, 3) gas and food inflation continuing, 4) economy that can't get legs, and 5) saga of Greek debt and ripples that never end. Add on top, the fact that QE2 has ended. History for QE1 and Japan QE's show that when liquidity is removed from a fragile economy, equities will take a hit. The 2nd quarter earnings will start to trickle out in a week and they can't be good. For example, BOA will be taking a big loss. Tech looks weak looking forward. So, get ready. Regardless of what my trend system says, the market is not a buy. The SPX daily chart below is what I expect. Todays action was great, but slammed into the 1313 pivot area and is held by a downtrend line as shown in the chart. IMO, don't expect much more upside. The pivot area can extend to about 1321, but I expect a reversal in this area. Why? A rising wedge is shown that has broke down in May after the 5 wave top. A wolfe wave is shown in grey that lines up between wave 1 and 4 and points at the wave 5 target. In this case it is pointing at SPX 1223. A wolfe wave is used in TA and an explanation can be viewed here:

http://www.investopedia.com/terms/w/wolfewave.asp

Misc other: Based on cycle theory, I expect a new low by about mid-August. My trend system should not be trusted right now to buy into a supposed uptrend. A better strategy is to trade snap back rallies from extremely oversold conditions. With the last 4 day wonder rally, the market is over bought. Of course the big boyz can try and defy gravity. But will they win?

spxwolfe.jpg
 
I apologize for lack of posting, but I have been very busy this summer. I was posting my trend system from time to time, but is hard to keep updated with my schedule. Now if I were retired... This market has been pulled to and fro much like a ride at the fair; big highs and wild lows and the acceleration is scary. So, after various analysis over the last several years, I have decided to only post the Rabbit trades, as they have done better in trials and involve less market exposure and hence risk to days like today if you were holding in a trend. Rabbit also works with the IFT rules for transfers pretty well. What is Rabbit? This system uses a combination of the following to find entry points: Elliot Wave theory, cycle theory, support and resistance, momentum, sentiment and relationships between various indices.

Today Rabbit has flashed a BUY for C and S These trades are short term and may last from 1-10 days. The F and I fund are not within the system at this time. I am expecting no more than a 1% downside risk and up to a 4% upside gain for this trade.

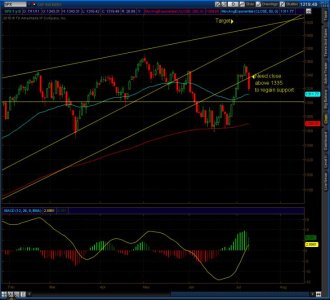
I presented a bearish view of the market the other day, but with the bull take-off wonder rally last week am now presenting the bullish case with reasons. Look at the SPX cash weekly and daily charts below. The weekly SPX (bottom chart) shows rising trendlines from the March 2009 lows. The lower trendlines intersect with the upper trendline between 1423 and 1459. This may be the top of the bull market. Last week, the market regained the lower channel line support, but has dropped back below so far this week. But we have a higher low and a rising MACD toward the zero line; both of which are bullish. On the daily SPX chart we see that a close above SPX 1335 is needed to regain the trendline. Also a close below SPX 1300 is an Elliot Wave violation and probably means that the uptrend has ended, if that were to occur. But I don't expect it.

Disclaimer: This data is for information only; each person is encouraged to seek financial advice from a professional investment advisor.
2011-07-SPXD.jpg

2011-07-11-SPXW.jpg
 
Trapped! Here is a weekly chart of the US dollar futures. Looks like a 5 wave down to me that is currently finishing wave 4. Notice the wedge that is forming. This should complete in 2 to 3 weeks or sooner before a break, which I read as down. IF SPX holds support, might be a good time to get into the I fund for a big gainer when the dollar drops. Fairly big drop tonight on the debt ceiling deadlock news. I guess PO stormed out of meeting. Hope PO and House can agree to something or else crash and that will make the dollar go down. Hope that is not it. Cycle theory suggests advance soon, but we shall see. Holding long for now.

2011-07-13-dx.jpg
 
Hey Uptrend, thanks for this info (7/13) about the USD in wave 4 getting close to finishing it. Also consider I vs S, say, referenced to 7/1, down by about 1.5 % more, so more spring-back potential, I think. I like your rabbit avatar. Cute. I'm new here and I just discovered your thread. It seems that the DX chart roughly correlates with the USDX chart (INO), not identical. Food for thought.

A few commentators are remarking that the mkt seems to be taking the debt-ceiling debate in stride, almost jaded to that stuff. That, plus Europe seems to have quieted down for the moment. Dollar spiking down, Euro spiking up (but just some in each case) as I write. It looks like it will be an up day -- good for the bulls.
 
Back
Top