Thanks, another nice tool to use.
Thanks eccouger. BTW cute avatar!
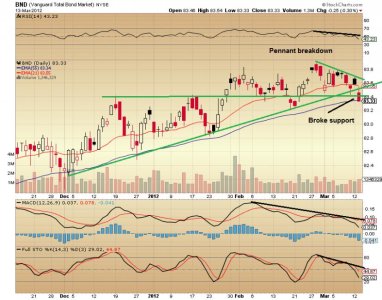
Here is the Uptrend cube for March 15, 2012. Note that bonds (F fund) really broke down and the intermediate trend is now down, and the long term trend is under the yellow caution flag. I don't know at this point if this is hedge fund manipulation or quite possibly Goldman Sacks doing someting, or a real problem. Lower bond prices mean higher interest rates, and it seems that will kill the fragile recovery.
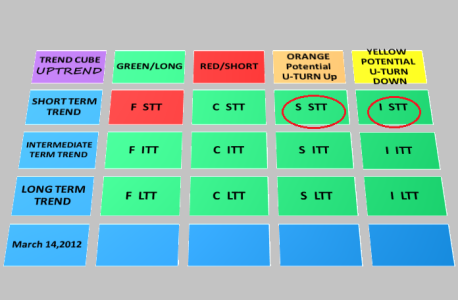
Despite the loss in C, S, and I funds today the short term trend (STT) as well as the ITT and LTT are up. No change and all green.
The market is very extended, but based on wave math, I see SPX 1439 to 1448 range as being very possible, before the market turns down. SPX 1386 is support, and there is minor resistance at 1406; otherwise clear sailing. I am kicking myself for missing most of this move (and feel a little foolish being so bearish when I saw signs to the contrary), but with the trend cube now in place, I assure you that it won't happen again. In other words, follow the TA, not your heart. BTW I note that institutions are buying today, and the focus is large caps. That is why I expect the C fund to outperform in the short term.
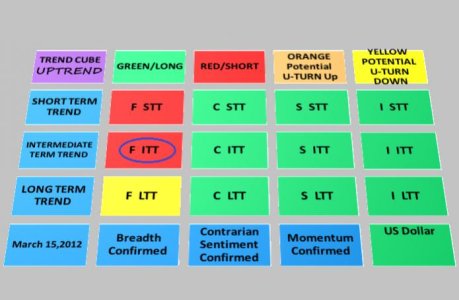
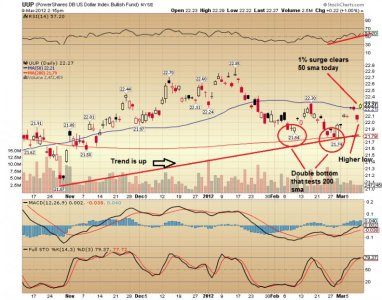
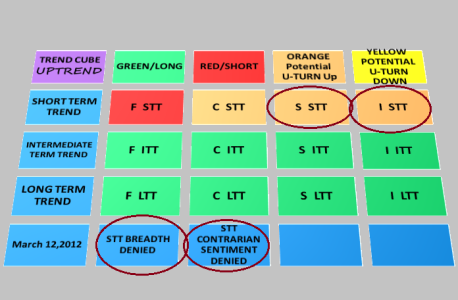
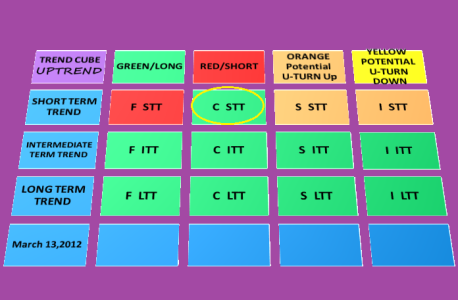
For the Uptrend cube, you read across. The top row is a header and explains the colors. The three trend time periods are shown down the left side, and you see the colors for each TSP fund, as whether they are in buy, sell, topping or bottoming status. The color squares may or may not change color each day, depending on what is happening in the market. Circled squares show what has changed from the previous day (Oops, the yellow F LTT square should also be circled today). The bottom row in blue shows the date to be used for, and some other general market information that the Uptrend system is based upon. Confirmed means that the green squares, in part, meet trend requirements like breadth, contrarian sentiment, momentum etc. The US dollar is shown in the bottom right square, and the STT is up. This is useful for the I fund fund interpretation of price structure. Hope this explanation helps.

