-
The Forum works well on MOBILE devices without an app: Just go to: https://forum.tsptalk.com
-
Please read our AutoTracker policy on the IFT deadline and remaining active. Thanks!
-
$ - Premium Service Content (Info) | AutoTracker Monthly Winners | Is Gmail et al, Blocking Our emails?
Find us on: Facebook & X | Posting Copyrighted Material
-
Join the TSP Talk AutoTracker: How to Get Started | Login | Main AutoTracker Page
You are using an out of date browser. It may not display this or other websites correctly.
You should upgrade or use an alternative browser.
You should upgrade or use an alternative browser.
Uptrend's Account Talk
- Thread starter Uptrend
- Start date
Uptrend
TSP Pro
- Reaction score
- 74
My Uptrend system (revised) is still on a sell for equities, despite the little pop today. The I fund is technically in buy mode, but I am not going to play. That is because the US dollar is close to a buy, and that should pull equities down. Bonds have turned down today (and am not sure why), but the uptrend in the daily timeframe that started December 2011 is still intact. Basically the bonds are uptrending in price, oscillating, and making higher lows. The next turn date for equities shouild be March 16. However, if the market turns up soon, that would be a continuation and non-confirmation. Do I sound confused? To be truthfull, the market is a mystery (to me) at the present.
jkenjohnson
Market Veteran
- Reaction score
- 24
My Uptrend system (revised) is still on a sell for equities, despite the little pop today. The I fund is technically in buy mode, but I am not going to play. That is because the US dollar is close to a buy, and that should pull equities down. Bonds have turned down today (and am not sure why), but the uptrend in the daily timeframe that started December 2011 is still intact. Basically the bonds are uptrending in price, oscillating, and making higher lows. The next turn date for equities shouild be March 16. However, if the market turns up soon, that would be a continuation and non-confirmation. Do I sound confused? To be truthfull, the market is a mystery (to me) at the present.
I agree with your MYSTERY statement.
Uptrend
TSP Pro
- Reaction score
- 74
A flat top has been building for the last month. With March upon us, the probability increases for a big move. Many big moves come in March for some unkown reason; whether the promise of spring triggers something in mass psychology,or the physical forces in nature kick in. Look at March 6, 2009 for example as the big reversal in the crash. A big low came in March 2011. Anyway big move tend to come in March. So the million dollar question; are we seeing a consolidation now and a spring upward of 100+ SPX points, or will there be a 100+ point SPX decline?
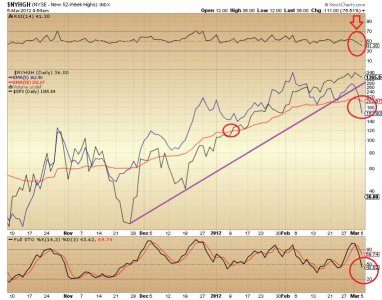
Here is a chart of 52 week highs

The top line is the SPX. The next two lines are the 5 and 50 emas. We can see that new 52 week highs have sharply declined in the last week and have fallen through the purple trendline and the 50 ema. Also the relative strength and stochastic are pointing down. New 52 week highs have declined from 280 to 160 on the NYSE in this timeframe. We need to see the brakes put on and a reversal if the market plans to move higher. Just MHO. So, time to place your bets.
Here is a chart of 52 week highs

The top line is the SPX. The next two lines are the 5 and 50 emas. We can see that new 52 week highs have sharply declined in the last week and have fallen through the purple trendline and the 50 ema. Also the relative strength and stochastic are pointing down. New 52 week highs have declined from 280 to 160 on the NYSE in this timeframe. We need to see the brakes put on and a reversal if the market plans to move higher. Just MHO. So, time to place your bets.
Uptrend
TSP Pro
- Reaction score
- 74
My post yesterday showed that 52 week daily highs were deteriorating. Today proves it. This downtrend is the first move over 20 SPX points on a daily closing basis (am expecting the move to hold) since December, 2011, and is likely wave 4. So, I am saying the upmove is not completed yet, but the downward target could be SPX 1290 or more likely 1270. Then wave 5 could finish at any length, but probably match wave one, or in other words end at SPX 1398 or 1378. Here are the waves: W1 1159-1267, W2 1267-1202, W3 1202-1378, W4 underway.
The US dollar appears to have turned up 5 days ago (with the big candlestick off the 200 ma support on UUP). The I fund will now take a beating, so IMO, get out now, even taking a >2% loss. The F fund is safe for now, but that is under evaluation. P&F charts show higher prices there.
On the news front we still have some kind of a soft default in Greece probably coming, and the Israel/Iran tension. And high oil prices killing the recovery. These are uncertian times, so capital preservation is advised. JMHO. There will be more opportunites to play the trading game.
RealMoneyIssues
TSP Legend
- Reaction score
- 101
Thanks for the update Uptrend !!
Khotso
Market Veteran
- Reaction score
- 27
Great update! Thanks ... wish i''d listened earlier. Guess I got suckered into the rally late ... big mistake, though it would have been a good move if I'd hit and run like I thought about. Key words ... thought about. Think I'll bail to G in the morning. Live and learn, eh?
Uptrend
TSP Pro
- Reaction score
- 74
We have a start. The vst oversold bounce should occur tomorrow. However, will there be follow through to the downside? The US dollar chart may hold a clue.

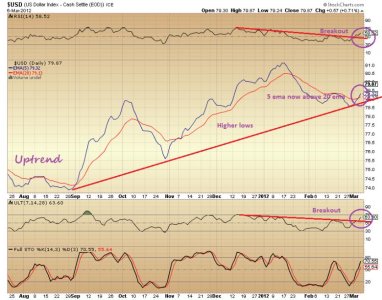
I have left price off the chart and just show moving averages. We see higher lows since September 2011. Now we see the 5 ema break out above the 20 ema. We see strength in the RSI and ultimate oscillator. And this move is just getting going. The general correlation is: US dollar up and equities down.
Don't fight the US dollar. Deflation in the US without a QE event, and trouble in the Eurozone have traders converting Euros to US dollars. That is a theory anyway.
Cycle theory says down till at least March 16, or chart relationships show SPX 1270-1290. It could take longer. Time to camp in the F fund for a while, or cash (G).
Uptrend
TSP Pro
- Reaction score
- 74
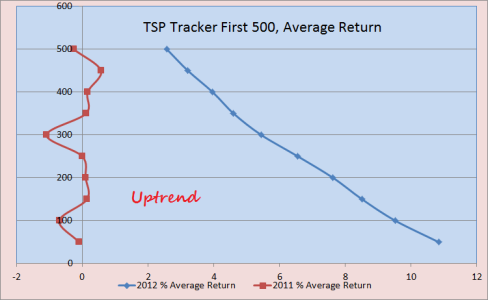
The take home message from my last post is that folks that ended very negative last year are mixed in with folks that ended very positive last year bringing the average down. This may mean that risk on has overpowered market timing so far this year for TSP participants.
clester
Market Veteran
- Reaction score
- 37
The last year has been very frustrating for most people. It's been like a casino. It's more guess work than usual. It's no wonder the average investor is out of stocks and will be for a long time. At least the high volume from the proprietary trading desks on Wall street is going away which has calmed things down.
Uptrend
TSP Pro
- Reaction score
- 74
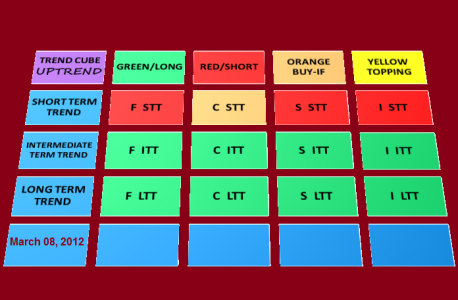
Here is my TSP Funds trend cube. It works in three timeframes. Short term means days to weeks; intermediate term means weeks, and long term means weeks to months. The shortest timeframe is daily. The cube has been doing very well, and I will start posting returns going forward. What is underneath it is part of my system. Short and intermediate timeframe trends give the best results. Now if I had been following it....
Colors blink on and off, depending upon market conditions.
Green means that there is a confirmed trend in progress in the specified timeframe. Price is advancing, so long positions. Good time to be in either, F,C,S or I depending what is green.
Red means you should be in safety (G fund) or the F fund, or short the market outside of TSP
Orange means that a new uptrend may began soon. If it is rejected in a few days, the color will change back to red.
Yellow means that the uptrend is losing momentum, meeting resistance etc, and is at the risk of a reversal.
This is my experimental system and is for educational purposes. Seek a qualified financial planner for all your financial decisions. I will post it when it changes. Sometimes that may be daily, but it can hold the same color scheme for days/weeks at times.

RealMoneyIssues
TSP Legend
- Reaction score
- 101
Uptrend, I am one of the stupid ones here so I am not sure exactly what this is saying.
Can you boil your signal down to a short, medium, and long term signal or is it subjective?
It looks to me like I should be in bond and equities, which typically move opposite each other, so I am wondering what you mean.
Can you boil your signal down to a short, medium, and long term signal or is it subjective?
It looks to me like I should be in bond and equities, which typically move opposite each other, so I am wondering what you mean.
Uptrend
TSP Pro
- Reaction score
- 74
Uptrend, I am one of the stupid ones here so I am not sure exactly what this is saying.
Can you boil your signal down to a short, medium, and long term signal or is it subjective?
It looks to me like I should be in bond and equities, which typically move opposite each other, so I am wondering what you mean.
I knew more explaining was needed. There is almost always more volatility or up/down movement, slop or whipsaws if you will, in the short term timeframe. This timeframe is also the most profitable. Bonds usually move opposite to equities in the short term timeframe, but can be doing different things in other timeframes. Bond prices are still moving up in the intermediate and long term timeframes. For example bond prices have been on a "more or less" steady climb since February of 2011 in the intermediate and long term timeframes. You can see this easily on the charts.
So, the short term timeframe is the most interesting and usefull for traders on the board. However, if you want to make only a few trades, don't have time for it and like a little more risk, the intermediate timeframe will do well. Results will be posted going forward. The trend cube does not help us allign with our 2 IFT per month limited trades on TSP. That is where a certian amount of strategy is required.
Last edited:
RealMoneyIssues
TSP Legend
- Reaction score
- 101
I knew more explaining was needed. There is almost always more volatility or up/down movement, slop or whipsaws if you will, in the short term timeframe. This timeframe is also the most profitable. Bonds usually move opposite to equities in the short term timeframe, but can be doing different things in other timeframes. Bond prices are still moving up in the intermediate and long term timeframes. For example bond prices have been on a "more of less" steady climb since February of 2011 in the intermediate and long term timeframes. You can see this easily on the charts.
So, the short term timeframe is the most interesting and usefull for traders on the board. However, if you want to make only a few trades, don't have time for it and like a little more risk, the intermediate timeframe will do well. Results will be posted going forward. The trend cube does not help us allign with our 2 IFT per month limited trades on TSP. That is where a certian amount of strategy is required.
Thanks!!
Uptrend
TSP Pro
- Reaction score
- 74
Do you shake it like the 8 Ball or roll it like the retirement dice? I like it.
Kidding.
Short Term- Next few days, the only thing you should be in is C or G,F?
Inter and Long- All equities look good?
Am I understanding this correctly.
It kind of looks like dice. I had too much fun trying to solve the Rubik's cube. I don't have to shake it, cuz wall st does that.
Yep It is saying short term G is safe, C is looking like a buy, and F is a sell. However, because of our limited IFT moves of 2x/month one might want to intentionally take a small hit in F, in order to catch a bigger bottom coming in equities (C, S,I). It is a strategy game, once you have the data.
BTW, if todays price action holds, C and S should turn green in the short term timeframe. The cube can go straight from red to green and bypass orange; it depends on momentum among other things. Decisions, Decisions.
crommie
Market Tracker
- Reaction score
- 9
One might want to intentionally take a small hit in F, in order to catch a bigger bottom coming in equities (C, S,I).
My thoughts exactly! Thank you Uptrend!
Similar threads
- Replies
- 0
- Views
- 113
- Replies
- 0
- Views
- 233
- Replies
- 0
- Views
- 170
- Replies
- 1
- Views
- 235

