Twodaystocks' Weekly charts

Ill try to post weekly charts of whatever fund I am in and why I am in that particular fund, as well as provide my feedback and opinions on the current market activity.
 
There is some chatter on CNBC regarding some positive news that could come out of europe later today. If that is true, I look for the markets to make their moves back towards positive territory.

26 Nov 12 C fund intraday.png

You can see the intraday chart of the S&P showed a pullback and test of its 50 moving average. It now looks to be testing the 20 moving average as resistance. We might see another test of the 50 as support before breaking higher around the same time this (hopefully positive) news breaks on CNBC. Fingers crossed.
 
I said earlier that the S&P might retest its 50 day moving average again before going any higher.

26 Nov 12 C fund intraday2.png

Looks like my short term prediction was correct, now my question is, will it hold and allow the S&P to close above 1400? I'll have to wait for the news this afternoon to find out, but the short term chart looks good.
 
Another technical intraday chart update showing the point where support was tested, then the chart broke out to a higher high than before and that breakout point became a tested support level. I LOVE TECHNICAL CHART ANALYSIS!

26 Nov 12 C fund intraday3.png

If the chart breaks out above its daily high point which is around 1404, that is a VERY good bullish sign.
 
You're posting a 5 minute chart in a thread titled weekly charts, you may start confusing the elderly...
 
Or just put it all in your account thread. You can put whatever the heck you want in there. :)

He did have a point. It was labeled the weekly charts, not the intraday charts. Ill just have to be more clear about what I am posting bc it is easy to get confused sometimes.
 
He did have a point. It was labeled the weekly charts, not the intraday charts. Ill just have to be more clear about what I am posting bc it is easy to get confused sometimes.


Sorry, I was scratching my head (for a second) wondering why my weekly's looked nothing like yours. Nothing wrong with a thread titled weekly's, some folks like to focus on that timeframe. More folks tend to get caught up in the heat of the short-term and forget to step back and look at the bigger picture, having someone keep track of the weekly charts helps everyone.
 
I've done that many many times and it's almost a panic moment for me every time. If we had more flexibility in our TSP transfers, I'd be more inclined to look at a daily chart rather than a weekly. I plan to load a chart and some opinions tonight.
 
My weekly charts show more room to move to the upside, but that is HIGHLY dependent on the news and economic data and revisions through the end of this week. More and more analysts, CEO's, and politicians are becoming more positive in their opinions regarding the fiscal cliff. However, if you look at Friday's daily volume for the $SPX, it was the lowest in over 6 months, by over half a BILLION shares. If you want to stay all F/G, I definitely dont think you are alone in your position and/or overall outlook on the market, but I am all in the C fund right now. My weekly charts crossed the buy line last week. With that chart, plus the economic news seeming to turn a bit more positive, I feel overall pretty comfortable about my decision.

The Intraday chart today showed a sell-off in the morning and then slow and technical buying throughout the rest of the trading day. The chart tested and retested its support along the 50 day moving average, slowly gaining strength. After 245pm, the chart moved higher and tested its 20 as support until the Heavy buying volume that pushed the final close back up to 1406.29, less than 3 points below its open at 1409.15.
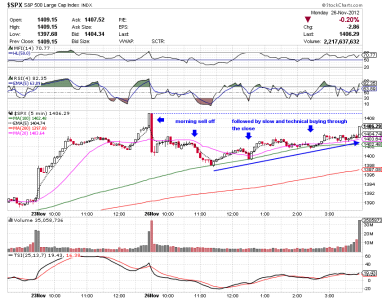
26 Nov 12 C fund intraday4.png

My Weekly chart below is still holding abve its buy signal line (EMA 5). Had there not been a normal sell-off in the morning, I believe the S&P would have climbed slightly higher than its previous close. Tomorrow there are a few economic numbers coming out, durable goods orders at 830, home price index at 9, and consumer confidence at 10. Most forecasts are for revisions/reports to be lower because of SS Sandy. I don't think they really know what to expect. If these numbers come in higher, I look for that to be a catalyst for the bulls. Any numbers slightly lower or in-line with expectations, I don't see having a great impact, because of Sandy. I think they will be brushed off as a sign of the storm rather than that of economic weakness. I guess only time will tell, but I don't look to try to move out of the C fund unless there is a significant move in the markets.
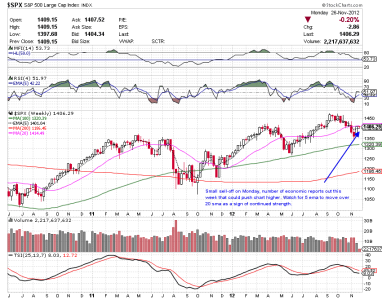
26 Nov 12 C fund weekly.png

As always, any opinions or comments are welcome!!
 
Tomorrow there are a few economic numbers coming out, durable goods orders at 830, home price index at 9, and consumer confidence at 10. Most forecasts are for revisions/reports to be lower because of SS Sandy. I don't think they really know what to expect. If these numbers come in higher, I look for that to be a catalyst for the bulls. Any numbers slightly lower or in-line with expectations, I don't see having a great impact, because of Sandy.

The numbers are unchanged from previous reports, which is actually an INCREASE from the economic forecasts by almost 2%. For now, the futures remain unchanged currently. If the home prices and CCI come in higher as well, I think it will be a great day for the bulls.
 
IWM needs to stay above 81.06 in order to break the down channel, it's tried several times and is flirting with it. 3 hours left in the day to see what happens :)

twoday are you a day trader by any chance? just wondering
 
Back
Top