Twodaystocks' Weekly charts

IWM needs to stay above 81.06 in order to break the down channel, it's tried several times and is flirting with it. 3 hours left in the day to see what happens :)

twoday are you a day trader by any chance? just wondering

I'm not a daytrader according to the SEC rules. ;)
 
What a crazy week! So much volatility and whipsaws this week it was crazy. It's times like these I am glad I don't trade on a daily chart. There were so many times I felt like playing it safe and pulling my money out and putting it back safely in the G fund, but I didn't. We will see next week if that was a good decision or not.
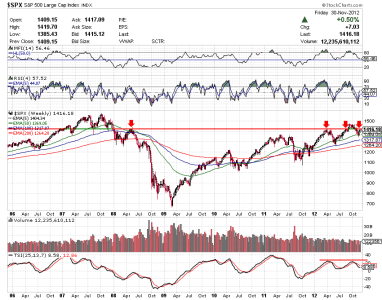
While I was looking over my charts, I went back a bit farther than my normal charts show and I noticed something that kind of worried me a little. 1425!!

30 Nov 12 C fund long term resistance.png

You can see in the chart that the 1425 level has been significant resistance for nearly 5 years. The S&P has only passed 1425 for a period of about 2/3 months since 2008! This could be bad, or, it could be an opportunity to reach new ALL time highs. If, and I know this is a huge "if", the fiscal cliff deal comes in the next 2 weeks, I am hoping to see a rally like we saw from March 2009 to April 2010 when the S&P rallied almost 75% from just under 700 to over 1200. Analysts have said it as well. When the cliff deal is signed, we have a great chance to see a 1000 point rally in the dow and I would expect the same from all major indexes. Sooner or later, that time will come and I hope we can all watch our TSP accounts explode. We all deserve it.
 
It looks to me like we are in the early stages of another mega trend secular bull run that could last another decade - I have been smelling the sweet smell of superlative bull manure for the last three years and many of my succulent wall flowers are starting to shine with a holiday glisten. Each one of those scary dips has been an opportunity to add positions and increase income. The wall of worry is high and the market will continue to scale the heights.
 
It looks to me like we are in the early stages of another mega trend secular bull run that could last another decade - I have been smelling the sweet smell of superlative bull manure for the last three years and many of my succulent wall flowers are starting to shine with a holiday glisten. Each one of those scary dips has been an opportunity to add positions and increase income. The wall of worry is high and the market will continue to scale the heights.

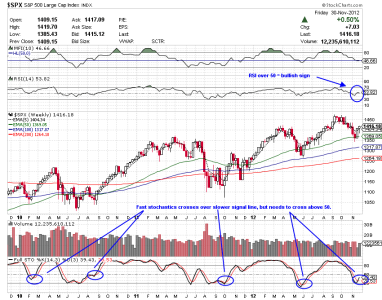
It's hard to find an indicator that shows a sign that indicates otherwise. The full stochastic indicator turned bullish last week and doesnst whipsaw often. Everything right now is so dependent on Washington. No other data, no matter how positive, seems to move the market for any significant amount of time. Maybe the positive news is piling up like a spring, just waiting for a solution to the cliff. :D

30 Nov 12 C fund bullish signs.png
 
It's hard to find an indicator that shows a sign that indicates otherwise. The full stochastic indicator turned bullish last week and doesnst whipsaw often. Everything right now is so dependent on Washington. No other data, no matter how positive, seems to move the market for any significant amount of time. Maybe the positive news is piling up like a spring, just waiting for a solution to the cliff. :D

View attachment 21351


What about the one that happened in June-July 2011? If you bought there you'd have bought right at the peak before the 2011 corretion.
 
Well, unfortunately there has never been an indicator or charting method that is 100% accurate 100% of the time. Having said that, by using the 5 EMA as my buy/sell point, I still would have been safe from the drop that followed. My method works for me with my TSP account. If you find a trading method that has NEVER failed, please let everyone know.
 
Twoday, sorry, I didn't mean to sound like I was being a jerk. I've been working on some trading systems and false signals really jump out at me so I thought I'd ask a question to see if you had a caveat or risk avoidance in place. Looks like you use the 5d EMA as a sell to limit any loss. Do you use it as a hard signal or just as a warning? I agree, there is no trading method that always works, and if I knew one, I would never tell anyone because that is the best way to make it not work anymore. Keep posting, charts are valuable!
 
Twoday, sorry, I didn't mean to sound like I was being a jerk. I've been working on some trading systems and false signals really jump out at me so I thought I'd ask a question to see if you had a caveat or risk avoidance in place. Looks like you use the 5d EMA as a sell to limit any loss. Do you use it as a hard signal or just as a warning? I agree, there is no trading method that always works, and if I knew one, I would never tell anyone because that is the best way to make it not work anymore. Keep posting, charts are valuable!

It is a hard buy/sell signal. The point at which I feel the weekly trend has decided which way it is going. I wasn't offended by the way. I didn't think you were being negative at all. I use the EMA as opposed to the SMA because it tracks a bit faster and I feel it limits the amount I can potentially lose, and also give me reliable buy signals to get ahead with my TSP. Thanks for the comment. Just keep in mind, the markets are very "cliff news" driven right now. There was a great deal of good economic news last week that was overshadowed by a couple of negative posturing comments by politicians. Good luck trading!!
 
Got scared out of C today when the Pres was talking. S&P hit 1402 and I did a stupid panic interfund transfer from c to g. I left to run an errand and when I got back, it was back up over 1410. IM SO DUMB!! Looking at the weekly chart, even though it hit near 1400 and was below its 5 ema, it did not CLOSE below it. Also, to make myself feel more ignorant, the weekly lows are ASCENDING, not DESCENDING. Long story short, I think I sold when I shouldn't have, especially with more news coming at the end of the week and congress taking a long weekend. Oh well, live and learn I guess. If I still like the chart at EOW, or Monday, I'll more than likely transfer back in.
 
Back
Top