tsptalk's Market Talk

Private payrolls increased just 37,000 In May, below the 60,000 in April and the Dow Jones forecast for 110,000. It was the lowest monthly job total from the ADP count since March 2023.
The calm before the storm. People starting to look at the impact of trade, tariffs, and the huge tax hike tariffs represent, and hesitating to hire.

Another two months and the bottom will fall out? Or will it be a side sideways?
 
Stocks are up this morning despite the weaker jobs data, but as I mentioned above, the monthly jobs data will be out tomorrow and estimates are looking for a gain of 125,000 jobs with an unemployment rate of 4.2% - no change from April.

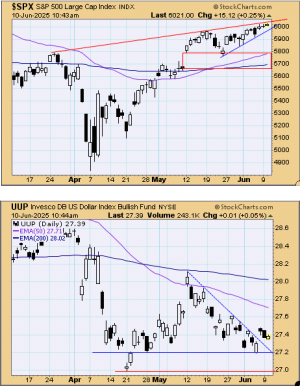
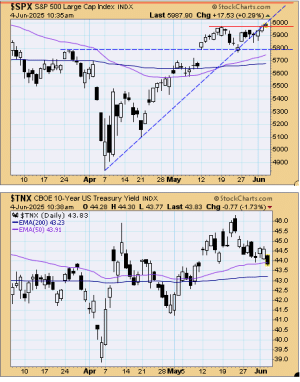
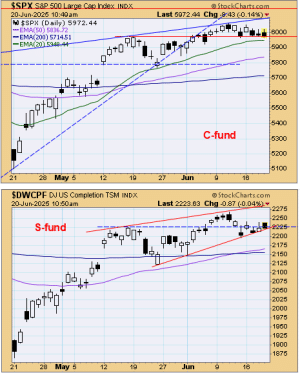
The S&P 500 is ticking higher again, and making a new multi-month high and right now looking to close above the recent intraday highs, and it continues to make its way up just below the old broken support line, turned resistance, but that resistance is rising.

tsp-060425a.gif

Yields are down this morning with the help of that weaker employment data and its trying to close below the 50-day EMA for the first time in a month.

Oil and gold are up modestly this morning, and bitcoin is giving back much of Tuesday's gains.
 
It started out as a slow, tentative morning for stocks as investors wait in anticipation for the results of the Trump and Xi trade negotiations and Friday's important jobs report.

Dip buyers showed up early but there's a long way to go in the trading day and there does seem to be some anxiety in the air.

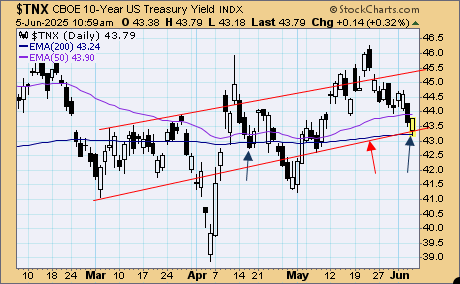
The jobless claim came in a little higher than expected but the continuous claims fell from last month. Yields seem to be a little volatile on that data as the 10-year fell initially, but found support and bounced back.

tsp-060525a.gif

I'll be on the road this afternoon but will check my email this evening and respond to any inquiries asap, or TommyIV will take care of it..
 
Last edited:
Beat estimates by 14K. Prior month revised down 30K. :unsure:

I know this is rearview mirror data already, but these negative revisions have become so routine that they should probably wait a month before releasing these reports?
 
The indices continue to grind higher on good, bad, or indifferent news, which means there is a purpose in this rally, and as I have been talking about for weeks, the spike in global liquidity in Q1 is the likely catalyst.

The chart is drifting up below some rising resistance, almost like an "F" flag, but there's no flag pole. This can move like up slowly like this for longer than feel comfortable, but in an "F" flag situation it usually resolves with a swift move lower. But again, that's not exactly what this is. We may find out soon enough as the S&P nears the apex of this wedge-like formation. Oh, and rising wedges also eventually break down, but when?

tsp-061025b.gif

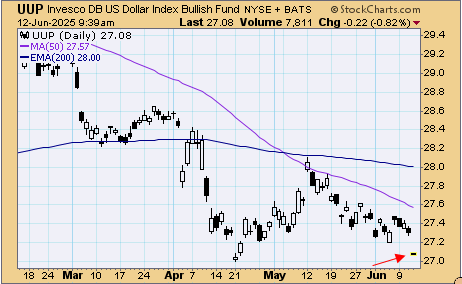
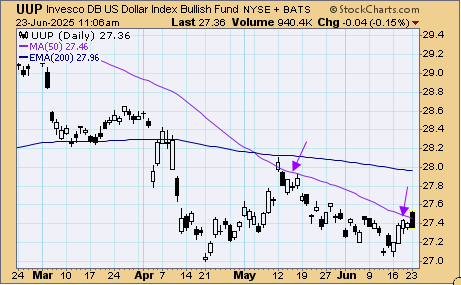
I have been calling for a low in the dollar for some time, and it too had something to do with the liquidity situation. The April low has been holding as the bottom, but it is not like this is racing back toward the prior highs.

The reason this is important is because it is a gauge on whether the I-fund will or won't continue to outperform the US TSP stock funds. A weaker dollar favors the I-fund.
 
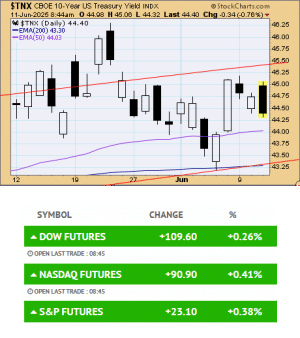
CPI Date sends yields lower, stock futures higher.

tsp-061125a.gif

 
Stocks are opening lower this morning on more tariff headlines, but they came well off the overnight future lows after the PPI data showed more signs of benign inflation.

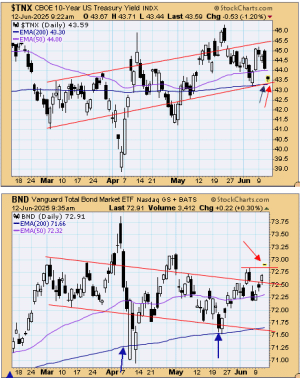
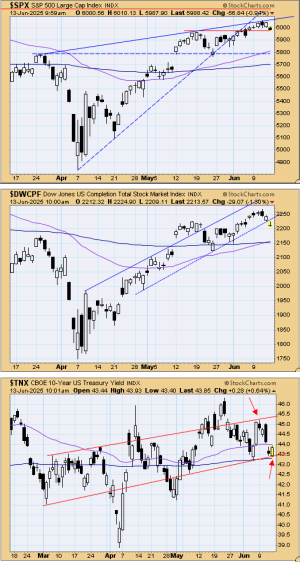
Yields fell sharply on the PPI data and the 10-year is now flirting with that trading channel support again.

tsp-061225a.gif

Meanwhile BND (the F-fund) broke out above its channel again, and right now is making a higher high above the early June peak. A new trend?

The dollar is also down helping you I-funders again. It's now flirting with a new low for the year.

tsp-061225b.gif

Oil is down in early trading, gold is up, and bitcoin failed to breakout again.
 
The overnight futures were much worse than cash market opened this morning, but this is still a shock to the charts.

The S&P 500 are so far contained above the May peak, although it is still very early and things could certainly change.

The DWCPF (S-fund) is talking a much bigger hit and falling below support with yields, oil, and the dollar all up big. That jump in the dollar is also negatively impacting the I-fund as well.

Gold is up on the geopolitical news, but if there was a major concern we'd probably see bonds up as well, but they are down sharply (with yields up.)

tsp-061325a.gif
 
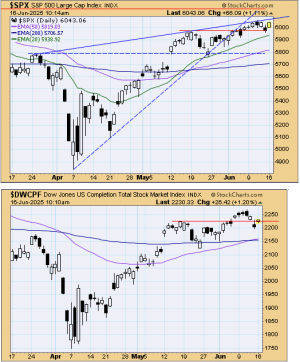
The early action has the S&P 500 nearly gaining back all of Friday's losses already. Too soon? The DWCPF (S-fund) is up big as well, but it still has a way to go to get back to Thursday's closing price, however both charts are back above the support lines they fell below on Friday.

tsp-061625a-gif.gif

There's still signs of fatigue near the recent highs and with the Fed decision on interest rates looming on Wednesday, it may be too much to ask to see higher highs, although monetary conditions are already very loose (good) and stocks tend to fare well under these conditions. However, the market is currently sensitive to negative headlines which could cause volatility, while climbing this wall of worry.
 
Is the glass half full, or half empty?

Considering what is going on here in the US, and around the world, the stock market is doing a pretty good job of hanging in there.

Yet another war, conflict, or whatever they are calling it broke out.

The price of oil has gone from $56 to $73 in recent weeks

A tariff situation that is tough to follow

A national debt that is off the charts

Yet the S&P 500 is still within striking distance of its all time highs.

Global liquidity is providing cheap and easier money opportunities which is a great catalyst for stocks and we will see interest rates fall by the end of the summer.

The latter are winning the battle and for good reason. Monetary policy controls the markets.

Day two of the FOMC meeting is tomorrow, and we have the Juneteenth holiday on Thursday (no TSP.)
 
Last edited by a moderator:
Is the glass half full, or half empty?

Considering the what is going on here in the US, and around the world, the stock market is doing a pretty good job of hanging int here.

Yet another war, conflict, or whatever they are calling it broke out.

The price of oil has gone from $56 to $73 in recent weeks

A tariff situation that is tough to follow

A national debt that is off the charts

Yet the S&P 500 is still within striking distance of its all time highs.

Global liquidity is providing cheap and easier money opportunities which is a great catalyst for stocks and we will see interest rates fall by the end of the summer.

The latter are winning the battle and for good reason. Monetary policy controls the markets.

Day two of the FOMC meeting is tomorrow, and we have the Juneteenth holiday on Thursday (no TSP.)
My magic 8 ball is so confused it dropped a digit and now it's a magic 7 ball.
 
The back and forth continues on this FOMC Wednesday. Today the bulls are doing some buying and trying to make it 7 straight days where the S&P 500 has alternated between gains and losses (yesterday was down.)

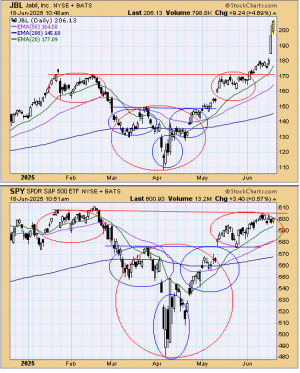
I have been highlighting a lot of inverted head and shoulders patterns in our daily commentaries lately, and I thought this chart from Jabil Circuits was a good illustration of how inverted H&S patterns tend to breakout.

tsp-061825a.gif

The S&P 500 is still within one of the right shoulders.

Oil is down today, gold is up slightly, and bitcoin is also down a bit as it lingers in the 105,000 area.

The Fed policy statement and interest rate decision will be at 2 PM ET today.
 
The back and forth continues on this FOMC Wednesday. Today the bulls are doing some buying and trying to make it 7 straight days where the S&P 500 has alternated between gains and losses (yesterday was down.)

I have been highlighting a lot of inverted head and shoulders patterns in our daily commentaries lately, and I thought this chart from Jabil Circuits was a good illustration of how inverted H&S patterns tend to breakout.

View attachment 69477

The S&P 500 is still within one of the right shoulders.

Oil is down today, gold is up slightly, and bitcoin is also down a bit as it lingers in the 105,000 area.

The Fed policy statement and interest rate decision will be at 2 PM ET today.
I don't know but I'm a little surprised at the green in the market. With the rhetoric from the administration and the Feds talking today.
 
Stocks popped higher this morning on comments from Fed member Waller saying interest rates may need to come down sooner than later - maybe at the July meeting. Those early gains have now evaporated and the indices are flirting with some key lingering support levels.

tsp-062025a.gif

Still the CME has only a 14% chance of a cut in July priced in.

It feels like holiday action with Friday trading following a Thursday holiday, but it also happens to be a triple witching expiration day so trading volume will be high. The Monday after a expiration Friday can see a reversal the current trend.

Yields are up and the dollar is down slightly. Gold, oil, and bitcoin are all down to flat.
 
Last edited:
  • Like
Reactions: Rod
Back
Top