tsptalk's Market Talk

The 3 major indices are down this morning, but the action is mixed with small caps and the Transports bucking the trend and rallying nicely.

The 10 year yield is up and, something we haven't talked about much, bitcoin is back over $41,000. Gold is making new all time highs, and what a great looking chart. This is a classic cup and handle formation.
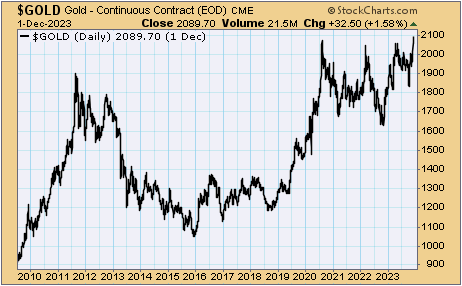
tsp-120423a.gif


I'm having some issues with stockcharts.com this morning. They are not updating the charts of the major indices, and several other charts that I often post.
 
Yields are down again, but the dollar is up.

Stocks are off to a slow start and the charts of the main indices certainly look like they need a pause or pullback, but how long will the FOMO dip buyers stand aside and do nothing? Especially in December?

All I know from experience is to expect the unexpected. We're due for a pullback so that becomes suspect, but if we do get one it may not be as easy as buying the bottom of the first gap filled. The market is always trying to confuse the market timers and get us leaning the wrong way.

Small caps are even down this morning, so that's a change.

tsp-120523a.gif
 
Thanks Tom

The exchange rate for me has dropped from $4.40 to $4 (10% ouch). I noticed the $USD looks to be forming a well structured V-Bottom over the past 5 sessions. I can't win here, the dollar goes up the markets go down, the dollar go down my exchange rate goes down....
 
It may have a little trouble going too much further, but it if does get above 104 - 104.50, then it could go.

tsp-120523b.gif
 
The TLT long bond ETF is pushing above its 200-day EMA this morning. Can it possibly just plow through after the run up from 82 to 95 in just over a month with almost no break? It tried a couple of times earlier this year and they all failed.

The situation for bonds is much different now but from a technical standpoint, even if this is going higher eventually, you'd expect a little exhale first.

tsp-120623b.gif


On the other hand the BND (our F-fund) sped right threw it last month, so? This one is actually testing its 400-day EMA right now (not shown.)
 
Once again the dollar seems to be the more influential than yields as yields are up, bouncing off the 200-day EMA, but the dollar is down, which is a breeze at the back of prices, and we see that with stocks opening the day higher on Thursday.

The weekly Initial Jobless Claims were near estimates while the continuing claims dropped compared to last week. That may be helping yields stabilize near that 200-day average.

tsp-120723a.gif


The open gaps on this dollar chart are too big too ignore, so to see it move back below the 50-day EMA after testing the bottom of that gap, and not entering it, is a little surprising.

Stocks continue to consolidate near the recent highs, which is impressive given the overbought conditions and extremes in many indicators, but they are are vulnerable up here - at least for the next couple of weeks before the Santa Claus rally period begins.
 
We will get the November Jobs Report on Friday and estimates are looking for a gain of about 175,000 jobs with an unemployment rate of 3.9%.

What will the stock market want to see tomorrow - a stronger than expected jobs report? A weaker than expected report? Or one inline with estimates?

Many stock and bond charts are at critical pivot points and tomorrow's report may be the excuse to push it in one director or the other - new highs, or a meaningful pullback.

A stronger than expected report will push yields up (much needed at this point technically) and that will push bonds and the F-fund down. But will stocks follow this time? Concerns of a recession would wane with a strong report, but it will also reduce the likelihood of the Fed loosening up next year.

Some Fed governors still think another rate hike is needed, and that not be embraced well by the market.
 
The bond market and credit market are having a more negative reaction to the jobs report than the stock market -- to start the day, anyway.

tsp-120823a.gif
 
Yields and the dollar are starting the day slightly higher and that's putting some pressure on the stock market, although the indices are attempting to turn positive.

Big week with the CPI tomorrow and the Fed on Wednesday. This guy talks about importance of Tuesday's bond auction:

https://twitter.com/jameslavish/status/1733874494845206715

It's an options expiration week so things could get volatile.
 
The November CPI came in at +0.01% over October's number which slightly higher than the 0.0% expected, and 3.1% year over year above last November's reading. 3.1% is still 50% higher than the Fed's target, but it's still moving in the right direction. Core CPI was inline with estimates.

Stocks are off a little after the slightly hotter number, while yields a down slightly but bounced off the lower pre-CPI yield (the bond market opened a half hour before the CPI was released.) The dollar also opened lower but has bounced back to just a minor loss.

Stocks opened modestly lower but are now mixed but mostly flat and now comes the test of whether we see another round of dip buyers taking the indices off the opening lows, which has been the trend of late.

Oil is down and trading below $70 again.

We get the PPI report tomorrow morning, and there is an important 30-year bond auction later today. The FOMC and rate decision comes tomorrow at 2PM ET.
 
The PPI report came in on the cool side with prices not up as expected by some. Yields are down only very slightly on this and the dollar is up after a weak open.

tsp-121323a.gif


The indices are mixed and mostly flat as this is all noise while we wait for the Fed decision on rates, the policy statement, and the Presser afterward when the fireworks will begin.
 
The 10-year yields fell below 4% this morning, and the dollar gapped down as well, and the dovish Fed policy rally continues in stocks.

tsp-121423b.gif


Smalls caps, both the S-fund and the Russell, each broke above their long channel's resistance lines with this morning's gap up. They made it look too easy and the 18 month channel is either done, or this is the mother of all fake outs.

tsp-121423a.gif
 
It's a quarterly expiration Friday which means there will be some manipulating and high volume trading as traders try to either sell these contracts at certain prices or roll them over into another date. I say manipulation because once it's over, come Monday, those restraints are off an often the market behaves more normally.

This expiration normally comes near the end of the weaker half of December (the first half) but we didn't have a weak half this year.

Yields are down slightly but the dollar is rebounding this morning. The stronger dollar is causing some red in the indices.

I said this a few days ago and it didn't happen, but volume spikes often occur near market reversals. We had a spike at the end of November but today's may be even larger because of the expiration. Will it be a turning point for stocks, or will Santa Step in and avoid that?

tsp-120423v.gif
 
It's very early, but the post expiration week starts with moderate gains in stocks, a move higher in yields, and a dollar that's doing something, but not sure exactly.

The 10year Treasury Yield is up, and as you can see in the second chart, there is some support at the recent lows.

tsp-121823a.gif


The dollar ETF, UUP, is showing it down 6% with a huge gap down, but the Yahoo quote has it only down 0.13% even though the price is about the same, so something must be going on like a split, dividend, etc.

Yahoo shows: 27.31-0.03 (-0.13%) as of 09:37AM EST. Market open.
 
The dollar ETF, UUP, is showing it down 6% with a huge gap down, but the Yahoo quote has it only down 0.13% even though the price is about the same, so something must be going on like a split, dividend, etc.

Yahoo shows: 27.31-0.03 (-0.13%) as of 09:37AM EST. Market open.

OK, this UUP chart makes more sense. Will the 200-day EMA mark a low, or will the filled gap act as resistance?

tsp-121823b.gif
 
A slow news week, lower yields, a weak dollar, and the bullish holiday bias is keeping the rally going this morning.

There's a lot of cash still on the sidelines and the bears are hibernating while talking heads are bullish, so is a trap being set for those rushing into stocks now?

Nimble traders may be able to handle this but will the average 401K holder see a correction coming?

Of course right now it's the bears being run over so the bulls and the buy and holders are basking in the sun, but will the prospect of lower interest rates pan out in 2024, and / or is a recession on the horizon for next year?

Next week's light volume trading could set that trap although the bears don't tend to come out that week so January may be more realistic. The January barometer may give us that answer in the first week of trading in 2024.
 
Yields are down and the dollar is up and FedEx is tumbling after reporting weaker demand, but that's not deterring the bulls as the weak open started to get bought up already. The indices are on a crazy winning streak with the Dow and Nasdaq trying to make it 10 straight.

The Santa Claus rally period hasn't even officially kicked it, but how much more can the bulls squeeze out of December? The bears may be done for the year but light volume trading next week could make things interesting, especially if there's a headline or two that can shake things up.

The buy and holders are rightfully basking in their day in the sun, but the recent angle of incline cannot be sustained and it's just a matter how much or a pullback we get, or time-wise, how much sideway consolidation we get to digest the monster two month rally.
 
Back
Top