I took a long weekend and wasn't able to post this week's charts as early as I would have liked, but better late than never I suppose.
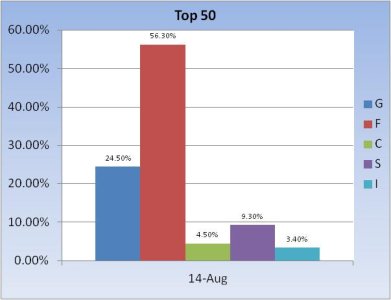
When I saw this week's numbers, especially for the Top 50, I had to double check my information because I was a bit surprised at the elevated F fund allocation. And the Total Tracker charts showed similar movement. Make no mistake, we are a bearish group right now.


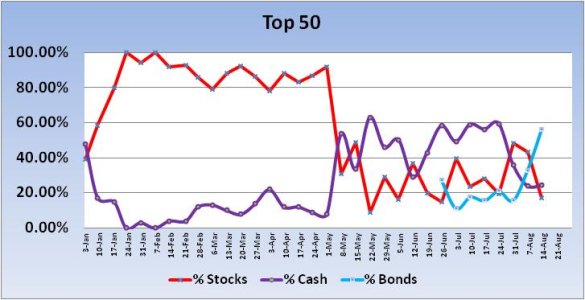
This week, the Top 50 spiked their bond exposure from 32.8% to a whopping 56.3%. Really? Total stock exposure fell from 43.2% to a paltry 17.2%.


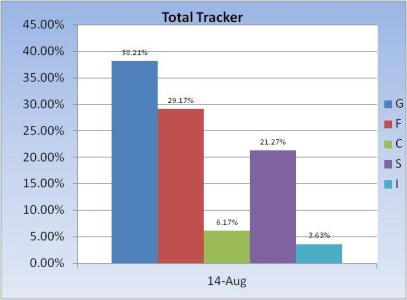
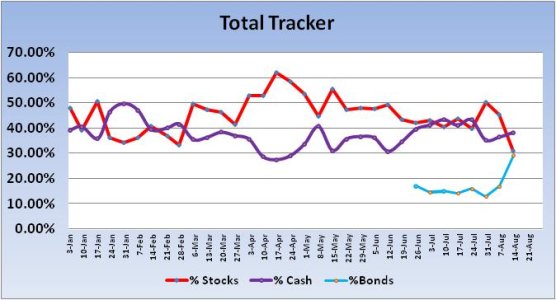
The Total Tracker also shows very elevated levels of bond exposure as we collectively jumped it from 16.86% last week to the current reading of 29.17%. Total stock exposure fell from 45.42% to 31.08%.
Our sentiment survey remains on a buy. Last week's signal was good for some nice gains if one was a bull. Let's see how this week goes given the more conservative positions.
When I saw this week's numbers, especially for the Top 50, I had to double check my information because I was a bit surprised at the elevated F fund allocation. And the Total Tracker charts showed similar movement. Make no mistake, we are a bearish group right now.


This week, the Top 50 spiked their bond exposure from 32.8% to a whopping 56.3%. Really? Total stock exposure fell from 43.2% to a paltry 17.2%.


The Total Tracker also shows very elevated levels of bond exposure as we collectively jumped it from 16.86% last week to the current reading of 29.17%. Total stock exposure fell from 45.42% to 31.08%.
Our sentiment survey remains on a buy. Last week's signal was good for some nice gains if one was a bull. Let's see how this week goes given the more conservative positions.
