nasa1974's Account Talk

Wish my crystal ball was back from the shop. :rolleyes: What a wacky week so far and I just do not have a warm fuzzy about jumping back in the water until next week. I know tomorrow starts 2 new IFT's but after the big day yesterday it just feels like a sell off is in the making. Monday could have the potential of blowing everything up with the stress test results coming out.:worried: Negative news seems to rally the market and good news sometimes has the opposite affect. If a lot of folks on this MB are right I have a chance to get back to my early 2008 numbers but to have that chance I have to be a bit more cautious. I was as low as -17.23% in March and YTD even though I am a -3.74% I feel pretty lucky. Over the weekend I will post my excel results on four months of "Buy and Hold" vs "<1% Option". The one thing that this rally has done is move the positive positions from the top 15 in the tracker down to the top 95.:) Good Luck to all.
 
This is a bit long but I found it interesting.

Below is the link and the beginning of the article. I tried posting the whole thing but I got an error saying I had 9 images in my message. http://www.thestreet.com/_yahoo/sto...tlook.html?cm_ven=YAHOO&cm_cat=FREE&cm_ite=NA

Birch do not flare your nostrils too much.:D Medic watch your snorting. :laugh: Enjoy the read.


Kass: A Rare, Long-Term Outlook

05/01/09 - 11:59 AM EDT Doug Kass

Not surprisingly, much of my writing deals with the near term -- namely, the outlook over the next several months -- as most investors and traders have that as their focus, but I do occasionally touch on the longer term, as I recently did in a discussion of "The Death of Buy and Hold." In actuality, though recent history might seem to counter the argument, the "real money" is typically not made in short-term "chops" rather it is made by thoughtful intermediate- to long-term investing.
As to the short term, I am sticking with my view that March 9 represented a generational low but that the road to higher ground (to be traveled during the summer) might be bumpy, volatile and could test the conviction of the bulls.
SPDR Trust (SPY) -- Expectations​


Bloomberg​


The fortuitous (accidental?) precision in my previous SPDRs (SPY Quote) forecast of two months ago (see above chart) as well as the continued seeming validity to the parallel with the late 1930s experience in the U.S. stock market (see below) suggest that I should test my luck and now focus on the longer term.
Dow in the 1930s and 1940s vs. Nasdaq Now
Very similar patterns


Reuters​
 
Does anyone have updated information on the stress test due out Monday?:confused: I heard that the report may be delayed.:( If that is true then it may factor into whether I jump back into the water early next week.:suspicious:
 
Jumped back in this morning. 20C, 40S & 40I. Sure did hate doing it on such a nice up day. Wish I had the guts to do it last Friday. But with the London and Japanese markets closed, tomorrow may prove to be better than today. Since 2001, May has had some pretty good numbers. So why not take a chance. Good Luck.
 
Here is a shocker. FRTIB patting themselves on the back again.


GovernmentExecutive.com

http://www.govexec.com/story_page.cfm?articleid=42651&dcn=todaysnews


All TSP funds increase in April

By Alyssa Rosenberg arosenberg@govexec.com May 4, 2009
All the funds in the Thrift Savings Plan posted significant gains in April, some rising by double digits. Those increases mean that five of the TSP's 10 offerings have grown in value since the beginning of 2009, helping to make up for earlier losses.
The S Fund, which invests in small- and mid-size companies and tracks the Dow Jones Wilshire 4500 Index, posted the largest gains in April, rising 15 percent. Since the beginning of 2009, the fund's value is up 2.98 percent, though significant losses in the financial downturn last fall mean it's still down 33.35 percent from the same time in 2008.
The I Fund, invested in companies in Europe, Asia and Australia, rose 12.13 percent last month, but its value is down 4.97 percent since the beginning of 2009, and at a 43.06 percent deficit over the past 12 months, the largest loss of any fund in the plan.
The C Fund, which invests in common stocks of large companies on the Standard & Poor's 500 Index and had the biggest gains of any fund in March, again posted strong returns in April, surging 9.58 percent. The fund is down 2.41 percent in 2009, and 35.26 since April 2008.
The G Fund of government securities and the F Fund, which invests in fixed-income bonds, made smaller gains in April, but rose in value since January 2009 and during the past year. The G Fund inched up 0.21 percent in April, while the F Fund rose 0.49 percent. The G Fund is up 0.85 percent since the beginning of 2009 and 3.45 percent since April 2008, while the F Fund is up 0.62 percent and 3.93 percent during the past year.
All five life-cycle funds got a boost in April, though all also have lost value during the past 12 months. The L funds are designed to move participants from riskier, but potentially higher yielding investments early in their careers to a more conservative mix as they reach retirement.
The L 2040 Fund, which is the riskiest mix of investments, increased 9.38 percent in April; the L 2030 Fund was up 8.20 percent; the L 2020 Fund experienced a 6.79 percent hike; the L 2010 Fund rose 3.20 percent; and the L Income Fund, the most stable option for enrollees about to retire, received a 2.37 percent boost.
Since the beginning of 2009, the L 2040 Fund is down 1.07 percent; the L 2030 Fund has fallen 0.69 percent, and the L 2020 Fund has decreased 0.39 percent. The L 2010 Fund has risen 0.29 percent and the L Income Fund is up 0.63 percent. During the past year, all the L funds have lost value. The L 2040 Fund has decreased 29.88 percent; the L 2030 Fund has tanked 25.91 percent; the L 2020 Fund has lost 21.42 percent of its value; the L 2010 Fund is down 9.62 percent; and the L Income Fund lost 4.71 percent of its value.
 
Everybody that jumped into the market Friday, May 1st. Great move!! Let's hope that yesterday was the spark that keeps the bulls running.
 
Ok, for what it is worth I have been tracking a Buy & Hold vs <1% Option since January 2nd. Attached are the account totals through April. Some explaination on what my thinking was.:D I started all funds with $100,000.00 on January 2nd. I had 5 Buy & Hold accounts, 80,5,5,5,5; 30,35,35 (CSI); 100C, 100S & 100I. The <1% started at 80,5,5,5,5 and finished on April 30th at 33.38, 4.91, 20.02, 20.31 & 21.36. I am not a fan of the F fund so I tried to keep that fund around 5% as much as possible. I made a <1% move before noon EST and averaged about 9 moves per month. I used Microsoft Excel.

Now the disclaimer. I am no expert, some assumptions where made and some errors may have occured. So if there are some real problems please do not hang me out to dry.:nuts:

OK folks here you go.
 
It would appear that your analysis concluded that your <1%IFT moves
faired better then the other strategies by the end of April. Did you find
the timing of your <1%IFT moves were based on random selection, or
based on pre-selected market conditions. Example: If the market moved
down two days in a row, you consistantly made a <1%IFT based on that
criteria ? ;)


SB, Didn't give it that much thought. If the market was negative just before noon than I made a <1% move. Sometimes it was a rebalance. Sometimes it was a move up to the next %.

In the next couple of days I will post the individual accounts for examination. :nuts:
 
Here are the followup charts for the Buy & Hold vs <1%.

All charts created in Microsoft Excel 2007 but saved in compatibility mode. Enjoy.:D

Attached are 3 charts (CSI)
 
Here are the next set of charts for the Buy & Hold vs <1%.

All charts created in Microsoft Excel 2007 but saved in compatibility mode. Enjoy.:D

Wouldn't let me attach all six charts so here are the final 3. :laugh:
 
Article from Seeking Alpha.

http://seekingalpha.com/article/136519-coppock-curve-is-about-to-give-a-bullish-signal?source=yahoo


Birch, Do not enjoy this too much.:nuts:


Coppock Curve Is About to Give a Bullish Signal

May 08, 2009

“I, for one, welcome our new bull market overlords.”

Is this just a really deceptive bear market rally or is it the real thing? While the debate still rages, the market keeps going and going and going… like the Duracell battery rabbit.
A reliable but somewhat esoteric long term indicator is ready to pronounce the birth of a brand new bull market. Just as long as the stock market can hang on to most of its gains by the month’s end.
If you’re not familiar with the Coppock Curve I introduced it last summer as one of the pre-requisite conditions for a new bull market. Click the previous link to learn more. The other conditions (recession, a 20%+ decline, easy monetary policy, etc.) have all been fulfilled. The stage is now set for the last piece of the puzzle.
In January I wrote a Coppock Guide forecast:

In that hypothetical scenario, the Coppock curve would turn up by the end of February 2009 by the minimum. And in March, it would turn up significantly.
I wasn’t trying to predict what the indicator would say and when so much as to show that we would need to see one hell of a rally for it to register a change of direction in the Coppock Curve. And did we ever! From the March bottom the S&P 500 rocketed up 36%. That not only surprised almost everyone, it was finally enough to force the Coppock Guide to curl up:
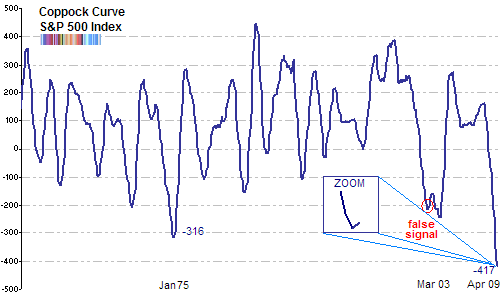
S&P 500 Index
Probably the most important of all the indices, the Coppock Curve for the S&P 500 Index is about to give us a new signal to indicate a new bull market. But before it can do that, the S&P 500 will have to close at or above 874 at the end of the month. That is a fairly small buffer area of 3.35%. If it can manage that, then we’ll see something like the zoomed in chart shown above.
As the 2002 false signal shows, while this lagging indicator has a fantastic track record, it is far from perfect.
Of importance is not just that we are about to see a respite in the continuous drop in the Coppock Guide but that this upturn (when it comes) will be from an extremely deep level. As you can see from the chart, we haven’t been here for a long, long time. According to the Coppock Guide, a new bull will be proportional to the bear market that preceded it. So a recovery launched from such an extremely negative level means that the new bull market will be powerful and long lasting.
Nasdaq Composite
The Coppock Guide for the Nasdaq Composite already gave us a signal at the end of April 2009. But I hold it with suspicion since in the past the indicator has not been too trustworthy. For example, going back to the last time we transitioned from a bear market to a new bull market, the Nasdaq Coppock Guide was off by a lot. It first turned up in December 2001. But that was a false signal. Then there was another signal in August 2002 and December 2002. Both were again false.
Finally, it curled up yet again in late March 2003, just as the nascent bull market was sprouting its horns. So you can understand my reticence in rushing to accept the Coppock signals from the Nasdaq index. The good news is that because the Nasdaq Coppock Curve has already turned up, it needs to do much less to prove itself and confirm the signal. In fact, we could see the Nasdaq Composite fall 7.7% to 1587 by the end of the month and it would still be enough to keep the Coppock Guide headed upwards.
Dow Jones Industrial Average
The Dow Jones Industrial Coppock Curve is also ready to curl up after topping in October 2007. If it can manage to close at or above 8210 by the end of this month (about 2% from here) a valid signal would be given.
Caveats Galore
So while, “I, for one, welcome our new bull market overlords.” we’ll have to wait at least until the end of the month to get a definitive signal from this trusty indicator. And as a final caveat, while the Coppock Guide has an enviable track record, like anything else, it isn’t foolproof.
 
If you where 100% I fund today congratulations. Wow what a week! Great finish after yesterdays numbers. Now we hold our breath for Monday.:nuts: Have a great weekend and "HAPPY MOTHERS DAY" to all the great Mom's out there.
 
To my Jedi master, Squalebear. May the force be with you for a swift and complete recovery.:cool:

With that said and Coolhand's report I have pulled back 50% into G. 50, 10, 20, 20 (GCSI).

Hoping the day ends all green. :blink:
 
Hoping the day ends all green. :blink:


Regardless, if you've been in this market for any of the last 9 weeks, than taking some profit off the table is a good idea. As for myself, I'm basing my IFT evaluations on End of Day closing prices, so I'll stay in until the tea leaves turn brown. :rolleyes:
 
Regardless, if you've been in this market for any of the last 9 weeks, than taking some profit off the table is a good idea. As for myself, I'm basing my IFT evaluations on End of Day closing prices, so I'll stay in until the tea leaves turn brown. :rolleyes:


Green tea is better for you. :laugh:
 
Back
Top