MrJohnRoss' Account Talk

I'm still holding AGQ, my long 2X silver position. The strength in the chart is waning a bit, but even if the lower thin blue support line is broken, there is long term support near 44. This trade may take a bit longer than I originally thought. Might not be able to take profits in the next week or two, but certainly in the next month or two. This week will be interesting to see how it breaks out of the inner triangle.

Good luck!


agq.png
 
Surprised to see the markets close higher today. The dollar index (UUP) was up .27%, and yet the markets held their own, and even continued their melt up. Advance decline lines for both the NYSE and Nasdaq continue higher. S Fund and C Fund both higher. I Fund continues to underperform. No sell signal yet for S or C, yet we all know it's just a matter of time until we finally get some sort of sell-off. It appears that the DJIA is rolling over, possibly in a large topping pattern. I also see divergences in that the PPO (MACD) on the S and C Funds have peaked, and are heading lower, while price continues higher. This is usually a sign that price will eventually catch up to the indicator, unless something happens to dramatically move the indicator higher (like a big move higher, which seems unlikely).

I remain cautious, but will continue to hold my S Fund position, as the melt up continues to grind higher.

Good luck!
 
Very busy at work/home lately, so not much time to post.

Sell signals generated yesterday for both the C and S Funds. I've moved to a 50/50 cash/bonds position. I'm also aggressively shorting the market in my other accounts with SRTY, TZA and SQQQ.

Good luck!
 
My best guess for this downturn is for the S&P to find support near the lower Bollinger Band, which is currently at 1491. That's a very small downturn, but looking at the last downturn in Dec, it produced a "V" shaped recovery rather quickly after testing the lower BB (see chart below). That being said, I would NOT be surprised to see the market move further down and test the 1460-1470 area. That would give the market a decent 5% pullback, and may be what's needed to wipe off some excesses and begin a fresh attempt at new highs.


$spx.png


Longer term, I think this economic recovery is on very shaky legs. Example: If Wal Mart is having problems with sales, you know people are hurting. That says a LOT. This is a consumer driven economy, and unfortunately, the consumer is becoming tapped out and living paycheck to paycheck. I doubt things will get better.

The other item I find interesting is the huge upturn in the dollar. Not sure if the inverse relationship with the dollar/stock market was decoupling, or if we just had a lagging effect here. The dollar index UUP is up VERY strongly again today, and the markets are finally paying attention. Lots of currency manipulation going on, and if you haven't already heard, George Soros has already made Billion$ off the drop in the Yen.

In other news, Gold and Silver look to be putting in a bottom here. If you like to trade the metals, this may be an excellent opportunity to go long here. I'm holding my AGQ position, and we are close to getting another buy signal.

Good luck!
 
Nice John. It certainly shows that the only way to really beat the market is to be out of it when it's going down.
 
Nice work John. Do you have your system's returns broken down by year? Looks like your system did a great job avoiding loss in 2008, but on that graph it kinda distorts the rest of the years
 
Is there an actual system you are using? Something you'd share? The chart just looks like every down instant you were out of the csi funds and into the g fund.
 
good stuff JR, do you usually go by the weekly chart as well? I notice our timing on moves in & out are usually a day or two apart
 
I use daily charts for my signals. I post all my signals here if anyone's interested, but my general advice is for everyone to perform ample due diligence before following these signals or anyone else's signals. It should be used for informational purposes only. These signals are given so that others know what I'm doing, but I'm not advising anyone to follow me.

Good luck!
 
As posted earlier in Clester's thread, if we get a 50% Fibonacci retracement in the S&P, we could see support around the 1437 area. That's about a 4% drop from here.


$spx.png


The 38.2% and 61.8% levels are around the 1459 and 1414 levels. Those are drops of about 2.5% and 5.5%, respectively.

Will be interesting to see if these levels are reached.

Good luck!
 
if sequestration happens, do you think it could be worse than a 5% drop? lot of uncertainty leading up to march 1. if they make a deal at the last minute, the markets can continue up as well.

but that's a lot of question marks haha.
 
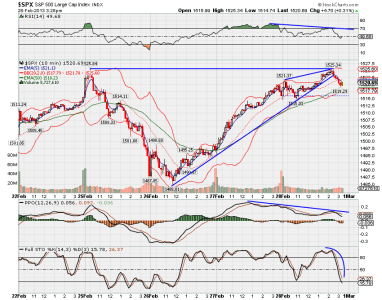
Here's a quick look at the 10 minute chart of the S&P 500:

$spx.png


A few things to note:

1. Market reached recent high, but did not go above.
2. Divergences in recent high compared to a lower RSI and lower PPO.
3. Break of the uptrend line which has been in place for the last 3 days.
4. Stochastic heading back down.

... and yet this market is such a mysterious puzzle. All the uncertainty about sequestration, (markets typically don't like uncertainty), and yet we're climbing the wall of worry. Could it be Helicopter Ben, pumping stacks of cash into the banks which is keeping the markets buoyed? I read the reports, just like everyone else, about how the consumer is pulling in the reins on spending, and all the retailers are getting worried. Currency wars, rising dollar, falling PM prices, rising gas prices... Seems like there is such contradictory information everywhere...

My longer term TA signals are pointing in many different directions at once as well. I want to sell my SRTY for fear of more big up days, and yet some logic tells me that we're looking at a big topping process that will take some time to unfold.

Meanwhile, big up days like the last two have me thinking and planning where my line in the sand needs to be. Then, when I think I can't take it anymore, and get ready to pull the trigger, the market sells off, and I find some relief in watching it fall for a while. It's been nuts.

This next week will be interesting to see how it plays out re: post sequestration.

Good luck!
 
Here's an updated look at today's opening minutes on that 10 minute chart of the S&P 500:


$spx.png

Geez. I thought we'd be heading down a bit, but this was quite unexpected!

It's like someone decided "let's buy the S&P exactly to the old top, to lure people back in, and then we'll pull the rug out from underneath them"!

:blink:

Good luck my friends.
 
Has anyone else been watching the action on the Dollar? Here's a chart of the dollar fund, UUP:


uup.png

It seems like a switch was flipped in February to ignite the dollar higher. Was this when the Bank of Japan (BOJ) decided to devalue their currency?

If this is part of the currency wars, it could spell trouble for the markets going forward, as a rising dollar is typically a negative for stocks.

Good luck!
 
Dollar up, market up

Dollar down, market up

POMO up, market up

Dow going to 14200+ to drag more people into the market... then the rug thing
 
Back
Top