MrJohnRoss' Account Talk

1972 was the December low for the S&P. The fear or hope is that the market will retest the low before going higher or lower. The bigger fear is that if it broke down below and continues it could re-test the low in October when the S&P hit the 1860s (Civil War times). Personal I am rooting for a big rise up into the future past 2015. :)

Best of luck!
 
Looks like the S&P is re-testing the 1992 level. It held today, but it sure is an ugly market. Unless we can get a strong rebound tomorrow, I'm thinking we re-test the Dec lows around 1972 before too long. :sick:

Shoulda woulda coulda gotten into the F Fund, just for today. AGG rocketed higher 46 bp. That's almost two months of interest in the G Fund. :blink:

If bond yields continue to fall, (and the F Fund climbs even higher), we're all in deep doo-doo, because it prolly means the markets are going to fall... big time. :-E
 
With the three day weekend coming up, I'm thinking investors might be a bit nervous about holding stocks over the long weekend.

Tomorrow is January expiration day. The Dow has been down 10 of the last 16 years on this date. Futures are down big, so it looks like we might up that percentage even more.

Looks like it won't be too long before we re-test that 1972 level. Possibly tomorrow. :blink:

Futures tested 1970 already...
 
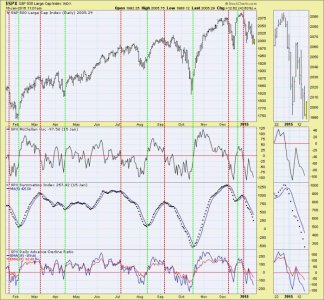
The updated graph of the S&P MOSI shows that it's actually worked fairly well as a rough timing model. The only downside is that it relies on end of day data, but if you're watching the markets carefully, you can figure out when the crossovers are going to occur during the day. You also have to know that when the markets are trending sideways, like they did last March - May, you may get plenty of whipsaws. I used the "trading box" to determine when the market was finally breaking out of it's range. As always, this is not a stand alone, one tool knows everything about the market indicator. Use all the other tools in your arsenal to help in your trading decisions.


S&P MOSI.jpg
 
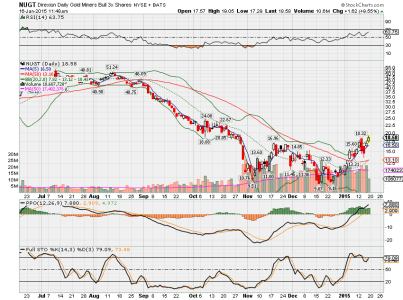
Gold, Silver and Miners continue their climb. Perhaps the bottom is "really" in place. (Shhhh, don't jinx it.) NUGT has now doubled from it's Christmas eve low. :nuts:


NUGT.png
 
Gold, Silver and Miners continue their climb. Perhaps the bottom is "really" in place. (Shhhh, don't jinx it.) NUGT has now doubled from it's Christmas eve low. :nuts:


View attachment 32032

I bought SIL in my roth IRA for a while back, now it's down less than -50%, just a matter of time before I break even, hey I got 30 years till I can withdraw that acct anyway :nuts:
 
[h=1]'Pin' Meet 'Housing Bubble 2.0'[/h]
... KB Home had revenues of $2.4 billion in 2014. They are one of the largest home builders in the country. It’s stock has dropped 30% in the last few days. It’s down 40% from its February 2014 high. It’s down 85% from its 2005 high. It had $9 billion of revenues and delivered 60,000 homes in 2005. Then Pin 1.0 popped the first bubble. Revenues collapsed to $1.3 billion and they lost hundreds of millions from 2007 through 2012.


Lennar had revenues of $7.0 billion in 2014. They are the largest home builder in the country. It’s stock has dropped 9% this week. It had been trading at a seven year high, but is still trading 33% below its 2005 bubble high. It had $14 billion of revenues and delivered 42,000 homes in 2005. Then Pin 1.0 popped their bubble. Revenues imploded to $3 billion and they also lost hundreds of millions from 2007 through 2012...

... Real median household income is exactly where it was in 1995. It is currently below the level of 1989. Average Americans have made no headway in 20 years. The median price of a home in 1995, according to the Census Bureau, was $128,000. The median price of a home today is $281,000. When prices go up 120% and your real income remains stagnant, even record low mortgage rates is just pushing on a string. With real wages continuing to fall, young people saddled with a trillion dollars of student loan debt, the full impact of the Obamacare neutron bomb (kills small business, doctors and jobs, but not insurance conglomerates or government bureaucracy) just detonating, and an economy clearly going into the tank, there is absolutely no possibility of a real housing recovery in the foreseeable future...
 
I don't know about that article. The writers "tone" (some excerpts below) seems to indicate he has an agenda. While he has some pretty charts and maybe some of his analysis does have merit there's a clear bias in his writing which leaves me to question the credibility of his argument. I'm not savvy enough of the financial markets to question his facts but when emotions seems to be the driving factor I find it hard to take the article seriously and it will have no influence on my financial decisions.

Just my two-cents.

"Federal Reserve/Wall Street/U.S. Treasury engineered scheme to repair the balance sheets of the insolvent Too Big To Trust Wall Street banks"
"The financial industry oligarchs and their servile lackey puppet politicians decided an easy money, Wall Street created scheme to boost home prices would benefit the .1% and restore some of their fraudulently acquired wealth."
"The fraudulent nature of the supposed housing recovery"
"massive monetary manipulation and insider deals"
"impact of the Obamacare neutron bomb (kills small business, doctors and jobs, but not insurance conglomerates or government bureaucracy)"
" Free money from their Federal Reserve sugar daddy, kicking people out of their homes and then renting their houses back to them"
"Maybe someone should ask Ben Bernanke at one of his $300,000 lunch time speeches for Bank of America what he thinks about the housing market. He does have an Ivy league education and did save the world."
 
Well, I'll tell ya, if all I listened to was the MSM, I'd be a dope. Personally, I find ZH articles interesting, thought provoking, and informative. But that's just me. Feel free to read (or not read) from any source of your choosing.
 
Mitt will be our savior - he will save the country. I'm holding my housing positions and actually buying more on weakness - Betula papyrifera has spoken.
 
"Last year the S&P 500 fell 3.6% in January and didn't rebound until February, eventually ending 2014 with a 13.7% gain including dividends. Stocks will recover this year as well, finishing with perhaps a 9% to 10% gain for the S&P 500, but only after a cloud of dust and no small amount of smoke."
 
"Last year the S&P 500 fell 3.6% in January and didn't rebound until February, eventually ending 2014 with a 13.7% gain including dividends. Stocks will recover this year as well, finishing with perhaps a 9% to 10% gain for the S&P 500, but only after a cloud of dust and no small amount of smoke."

Much stronger headwinds this year, it seems.
 
Here's a recap of today's market:

First it went up.
Then it went down.
Then it went back up.
Then it went down.

Any questions? :toung:
 
Here's a recap of today's market:

First it went up.
Then it went down.
Then it went back up.
Then it went down.


Any questions? :toung:

Upside down, you're turnin me, you're turnin me
Inside out...Oh yeah

I'm sorry MJR, the tune just popped into my head as I read your post!:nuts:
 
Back
Top