MrJohnRoss' Account Talk

I agree, the chase for performance and the potential for window dressing and setting up for the new year makes for an exciting EOY Santa Rally.

Of course we all have to be careful following big elephants too closely can provide big exhaust and even drops . :)
 
Looks like I'll be entering $EMW at 1045.65, up 1.73% today. Dayam.

The 401k was up over 3%, and is now in uncharted territory. Top three holdings:

CURE: +8.62%
TQQQ: +7.49%
BIB: +7.06%

Such a massive push today, but we're reaching short term overbought levels here. Wouldn't be surprised to see a pause/cooldown tomorrow. If you're not in yet, tomorrow may give you your best chance.

Thank you Santa.

My PnF time scale hasn't flipped yet, but today's price action was impressive. Not sure if I'll chase at this juncture, mostly because closing out the year, I have little to gain, I'd rather finish the year in the green, then in the red, and since I'm currently at 2.14% there isn't much wiggle room.
 
My PnF time scale hasn't flipped yet, but today's price action was impressive. Not sure if I'll chase at this juncture, mostly because closing out the year, I have little to gain, I'd rather finish the year in the green, then in the red, and since I'm currently at 2.14% there isn't much wiggle room.

I'd consider a drop of over 2% between now and the end of the year as very remote. But we could see a rise of 2%.
 
According to technical analyst John Murphy...

"SANTA CLAUS RALLY IS STILL AHEAD ... The stock market is benefiting from a number of seasonal trends which should last well into the new year. For one thing, the month of November starts the "best three months" span that lasts into January, and the "best six months" span that lasts into April. December itself is historically the best month for the S&P 500 and the second best for the Dow and Nasdaq. And the second half of the month is usually stronger than the first. There are at least two reasons for that. The first is the so-called Santa Claus rally which is usually concentrated during the last five trading days of the year and the first two in January (according to the Stock Traders Almanac). Traders usually buy in anticipation of that yearend boost, as they appear to be doing this year.... "
 
Just took a look at the MOSI indicators. Interesting to see that only three have switched to buy signals; Energy, Industrials, and Small Caps, although the rest are putting their brakes on as if they are getting ready to turn up.

The MOSI is based on lagging EMA's, specifically 19 and 39 EMA's. The difference is either added or subtracted to create the Summation Index. It's really quite ingenious, but unfortunately, it's not going to help you forecast the exact top or bottom of every market move.

Oh sure, you could play with the EMA's and shorten the time span, but that comes with a price... increasing the possibility of getting whipsawed with a head-fake. You may want to add a 5 EMA to the MOSI as a trigger to minimize whipsaws.

The MOSI is still very useful information, and is a good indication of market momentum. I'll keep it in my watchlist. Ya never know what else you might learn from it.
 
Thanks for the information on the MOSI. Is this a widely available indicator? I have been using Stockcharts (free version) and can't find it.
 
Thanks for the information on the MOSI. Is this a widely available indicator? I have been using Stockcharts (free version) and can't find it.

Yes, it's available on Stockcharts. You can click on Market Summary, then at the bottom of the page, they provide the oscillator and summation index for the NYSE and Nasdaq.
 
Yes, we appear to be in market hyperdrive. Sometimes you simply have to swing big when it seems outrageous to be doing so.
 
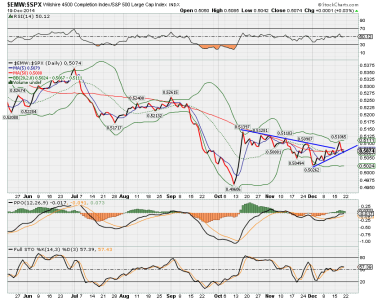
I studied the long term (weekly) and short term (daily) relative strength charts for C, S and I, and decided that the tides are turning in favor of S. The daily chart shows S outperforming C since Dec 1st, and breaking the downtrend line. The weekly chart also appears to show that S is bottoming out and turning higher. So even though S is underperforming C today, I've gone 100% S.

Here's the daily relative performance chart of S vs C.


S vs C.png


When S is outperforming C, the line is moving higher. This year, large caps have been outperforming small caps, so the bigger trend has been downward.

That may be about to change. We're now entering the seasonally strong period for small caps. Most of the so called "January Effect" now takes place in the last half of December, and strongly favors small cap stocks.

According to the Stock Traders Almanac, over the last 27 years, using the period from 12/15 - 01/31, the R2K returned 4.2% compared to the R1K's return of 2.4%, or nearly double the return. Most of that outperformance occurred during the end of Dec.

Looking at the chart above, this December is favoring small caps, and the downtrend line from Oct has been broken. There is also a downtrend line from the July high (not shown) which has also been broken. The 50 day is beginning to turn up, and the RSI says we're not even close to being overbought.

Of course, nothing is ever 100% guaranteed with the stock market. But with a very strong history on our side, the odds certainly favor small caps at this time.

Good luck!
 
One of the stocks I see doing well during this downturn is a well known tech stock....

...wait for it...

:rolleyes:

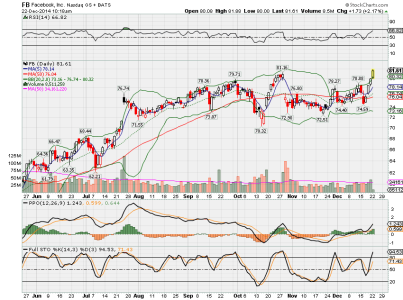
Yep, I think FB is getting ready for a ramp higher. PPO, Stoch and RSI are all climbing, and it appears to be getting ready to break out of a consolidation phase. It's near 78.50 today. If it can clear the recent high of 81.16 (convincingly), then you may see it do very well in the near term.

*This is not a recommendation to buy, sell, or trade any security. For educational purposes only.*

FB stock trading alert: We now have a nice solid breakout above the 81.16 previous high.

fb.png
 
Back
Top