MrJohnRoss' Account Talk

Glad to see the markets move a little higher today, since it was a sell day for me. Rode the S Fund proxy $EMW from 1015.10 on 8/11/14, to today's close of 1042.31, which is a gain of about +2.7% in just under a month.

I still believe we're heading lower for short time in order to "pause and refresh". Markets don't go up every day, so it's time for a little down wave. The gas pedal has eased off considerably, and momentum is dropping quickly. Will likely watch the market coast downhill, and wait until I see the accelerator pedal start back up before getting back in.
 
One other quick thought... and it's not a good one...

With tomorrow being September 11th, a lot of radical terrorists like to strike on this anniversary, so I'm actually glad to have stepped out of the markets today.

Let's hope I'm wrong, and nothing happens.

God Bless America. We need it.
 
Glad to see the markets move a little higher today, since it was a sell day for me. Rode the S Fund proxy $EMW from 1015.10 on 8/11/14, to today's close of 1042.31, which is a gain of about +2.7% in just under a month.

I still believe we're heading lower for short time in order to "pause and refresh". Markets don't go up every day, so it's time for a little down wave. The gas pedal has eased off considerably, and momentum is dropping quickly. Will likely watch the market coast downhill, and wait until I see the accelerator pedal start back up before getting back in.

Same for me. Selling today ended up being better than yesterday. I'd like to see a big enough dip so that I can jump in by late Sept and ride the market through the New Year.
 
Same for me. Selling today ended up being better than yesterday. I'd like to see a big enough dip so that I can jump in by late Sept and ride the market through the New Year.

Yessir. The seasonally strong period begins in November, so my bias will be towards the markets once we get to that point. ... assuming there are no other overriding reasons to stay out, of course.

Statistically speaking, September is the worst month of the year. Let's see how 09/14 plays out.
 
The market has begun to apply pressure to the gas pedal, and the tachometer is beginning to slow it's descent. Depending on which index you're looking at, (I usually use the S&P by default) this could either be a head-fake rally, or the little mini down wave is complete. I'm betting that we're going higher for a little while longer, so into the C Fund we go. (S Fund has been lagging the C Fund as of late.) This is my 2nd IFT for Sept., so I'm hoping this up-wave lasts into Oct., as I prefer to be fully invested going in to the new month. Not that the market cares.

On a side note, it's hard to believe Sept is more than half over. :blink:
 
NUGT appears to be bottoming, if you're playing the NUGT/DUST trade. Have some cash on the sidelines, so I may consider it. Also considering picking up some BABA on Friday.
 
Picked up a little NUGT at 32.82. We may bounce around a little more at the bottom for a few days, but this looks to me like a pretty good spot to get in.
 
Hopefully 30 holds. If not, it looks like we retest the lows in the mid 20s.

May buy another lot when I see a bottoming pattern take shape. The strong dollar is whacking commodities at the knees right now. There is always a chance for profit when there is fear in the streets.
 
Made a move to the G Fund. Don't like selling on strong down days, but this has all the earmarks of a right shoulder down pattern. Could be a troubling October ahead for the markets. Would not be surprised to see a technical rebound tomorrow, but I think it will be short lived.

Good luck!
 
Made a move to the G Fund. Don't like selling on strong down days, but this has all the earmarks of a right shoulder down pattern. Could be a troubling October ahead for the markets. Would not be surprised to see a technical rebound tomorrow, but I think it will be short lived.

Good luck!
If history is any indication, and we know how that goes, I think we could have a good October during this mid-term election year. It's getting out of September that may be the tough part.

It's an old chart so the "You are here" is obviously off...

042114f.gif


Mid-terms are every 4 years so there is not a ton of data here in this 59-year chart. About 14 or 15 in total, and it doesn't include 2010.
 
Mid-terms are every 4 years so there is not a ton of data here in this 59-year chart. About 14 or 15 in total, and it doesn't include 2010.
I just checked and September 2010 was actually a HUGE month for stocks, with the S-fund gaining 11.5%. So much for history. The S-fund was also up 4.5% in October 2010.
 
I have been thinking about you and your flip how is it go n?

Moved into the fixer upper a couple of weeks ago. 90% of construction has been completed, with about 10% more to go. Much harder to do while we're living there. Didn't have a fridge for a couple of days, so had to fill up the tub with 90 lbs of ice to store all of our reefer and freezer goods. No kitchen sink for about a week, so washing dishes in the bathroom was a chore. Little by little we're starting to make it come together. Our contractor got bought out by a multi-millionaire, (yes, he's that good), so future construction will be very limited on his off days. The wife is happy with the new property... she wanted a little house on a big, quiet parcel, so that's what we've got. Much different from our mini-mega mansion in the burbs. Thanks for asking. Hope all is well with you, Guchi. :)
 
If history is any indication, and we know how that goes, I think we could have a good October during this mid-term election year. It's getting out of September that may be the tough part.

It's an old chart so the "You are here" is obviously off...

042114f.gif


Mid-terms are every 4 years so there is not a ton of data here in this 59-year chart. About 14 or 15 in total, and it doesn't include 2010.

Wish we could trust history to tell us the future, but it doesn't always work out that way. According to the chart, we should have been negative through the first nine months of the year (-4%), but here we are up about 6.4%. Maybe we'll get a positive bias for October, but this year's chart sure looks like a head and shoulders formation to me. Of course, I've been wrong so many times that I may be proven wrong yet again. Thanks for the chart, I do enjoy looking at other points of view. Would like to post a chart of the S&P a little later that shows some support in the 1950 area. If we go much below that, we might be in trouble. The long term chart says we're still in a bull market, so it all depends on your timeframe as to how you want to play this.
 
JR glad things are work n out with the house. I did not realize you we're go n to move into it, I thought you said it was a flip house. I just moved into a little 2 bedroom house myself, good luck finding room to put all your belongings into the smaller house. It has been a challenge for us. We had a yard sale before moving and still have boxes to unpack when we find space. Glad mamma is happy, you know what they say.
 
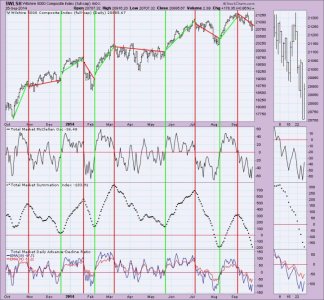
Here's an idea for using TA for spotting turning points in the market... a chart of the Wilshire 5000 utilizing the Total Market Summation Index. Note that it's fairly simple to spot turning points in the Summation Index. I provided red vertical lines at the tops of the Index, and green vertical lines at the bottoms. I also provided red or green lines on the W5000 itself to see whether the market went up or down during the buy or sell signals. Looks fairly impressive. Yet another tool in the arsenal?

Summation Index Turning Points.jpg
 
Back
Top