jkenjohnson
Market Veteran
- Reaction score
- 24
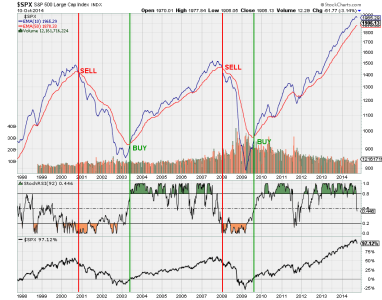
Here's an idea for using TA for spotting turning points in the market... a chart of the Wilshire 5000 utilizing the Total Market Summation Index. Note that it's fairly simple to spot turning points in the Summation Index. I provided red vertical lines at the tops of the Index, and green vertical lines at the bottoms. I also provided red or green lines on the W5000 itself to see whether the market went up or down during the buy or sell signals. Looks fairly impressive. Yet another tool in the arsenal?
View attachment 30386
It's easy to chart after the fact. If you can find a way to establish triggers like JT asked, then you may have something very valuable.

