Perhaps there has been some pent up anxiety waiting for the earnings reports? Whatever the reason(s) for the market’s correction, it does appear folks won’t want to be invested until after the report cards show their true value.
<o></o>
I’ll be the first to admit, it’s tough to stay invested. But it can be even tougher to time 2 IFTs with lousy end of day prices. So for now I’ll sit and wait for the market to unfold. I haven’t decided if I’ll pull back completely to G/F or double down my remaining 25% F into stocks.
<o></o>
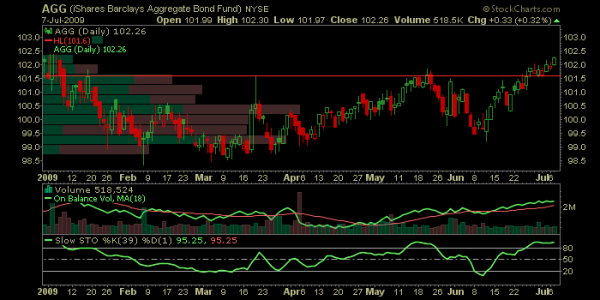
The AGG chart is looking great.
<o></o>
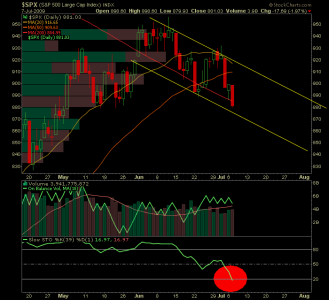
I realize a whole lot of folks are watching the potential Head & Shoulders. While it is in the back of my mind, I’m not dwelling on it. After all, there are plenty of other folks out there watching it too. So for now, I’m just keeping an eye on the descending trendline. This week, I’d hope to see a bounce between 870-880, any lower any faster and I’ll start to get worried.
<o></o>
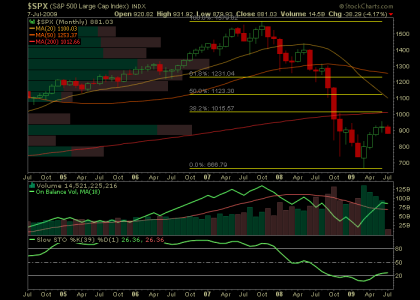
On a side note, the monthly chart is giving us long-term investors fair warning. Thus far July has put in a lower high and a lower low. As a buyer, I’d like to see 777, and as a seller 1015.
<o></o>
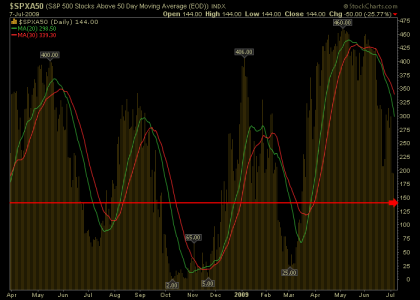
On the $SPXA50 we still have more room to fall, but we are getting close to the previous July 2008 bottom.
<o></o>
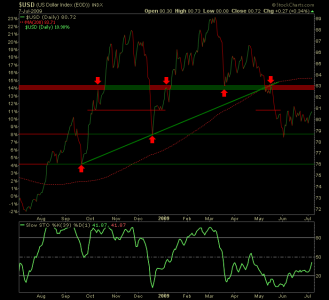
Since drawing up this chart back in June, the dollar has been in a tight trading range. You would think with the recent drop in Oil the dollar would be reaping the benefits? Perhaps previous government intervention has something to do with it but I wouldn’t know.
<o></o>
Cheers...
<o></o>
<o></o>
I’ll be the first to admit, it’s tough to stay invested. But it can be even tougher to time 2 IFTs with lousy end of day prices. So for now I’ll sit and wait for the market to unfold. I haven’t decided if I’ll pull back completely to G/F or double down my remaining 25% F into stocks.
<o></o>
The AGG chart is looking great.
<o></o>

I realize a whole lot of folks are watching the potential Head & Shoulders. While it is in the back of my mind, I’m not dwelling on it. After all, there are plenty of other folks out there watching it too. So for now, I’m just keeping an eye on the descending trendline. This week, I’d hope to see a bounce between 870-880, any lower any faster and I’ll start to get worried.

<o></o>
On a side note, the monthly chart is giving us long-term investors fair warning. Thus far July has put in a lower high and a lower low. As a buyer, I’d like to see 777, and as a seller 1015.

<o></o>
On the $SPXA50 we still have more room to fall, but we are getting close to the previous July 2008 bottom.

<o></o>
Since drawing up this chart back in June, the dollar has been in a tight trading range. You would think with the recent drop in Oil the dollar would be reaping the benefits? Perhaps previous government intervention has something to do with it but I wouldn’t know.

<o></o>
Cheers...
<o></o>
