JTH's Account Talk

Happy Easter

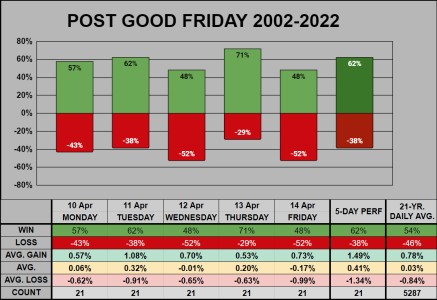
As per the usual, I completely forgot the Stock Market would be closed on Good Friday, thus I forgot to post some pre-holiday stats. These stats don't line up so well when compared to other major holidays that fall on a consistent day. From the past 21 years, 3 Good Friday's fell in March, while the rest fell in April.

Overall, the week is above average, with Thursday having a 71% win ratio, and Tuesday having a 1.08% average (of all gains counted).
20230407-HOL.png
___
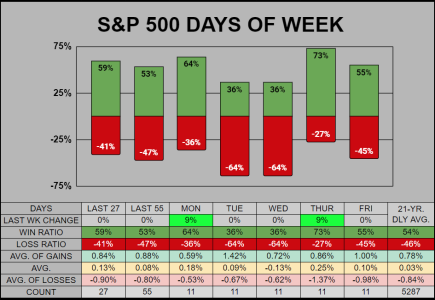
For the Day of Week stats, Mon/Thur look great, with Tue/Wed looking weak.

-- Last 8 of 11 days have closed up.
-- Last 3 Mondays closed up, last 6 of 7 closed up.
-- Last 4 Thursdays have closed up.
20230407-DoW.png

___
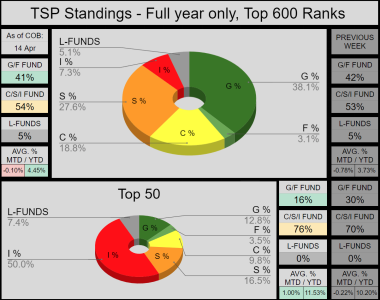
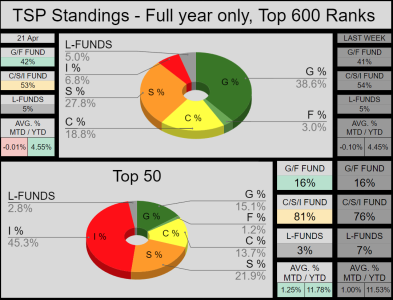
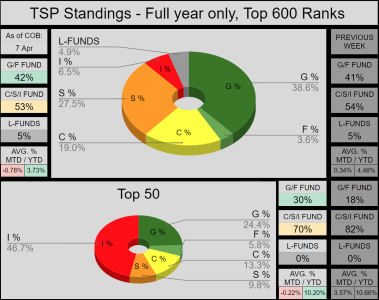
There was little change on the Top 600 participants, we lost -.73% last week. The top 50 lost -.46% last week, but also reduced their risk, with the CSI allocation average decreasing 12%. The I-Fund allocation is 46.7% maybe that's the smart money :)
20230407-AT.png


Have a great week :)
 
Good morning

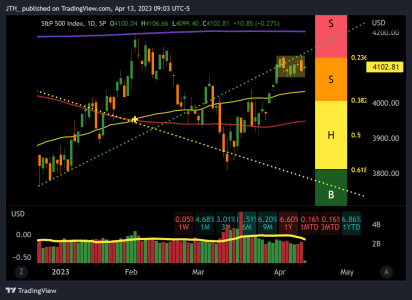
Another period of low volatility & low volume. We are on day 8 of a confined range of 1.5%, it is utterly boring for me. Not enough action to take an exit nor an entry. My best guess, is everyone took the week off and is waiting for someone else to take the positions.
20230413.png
 
Good morning

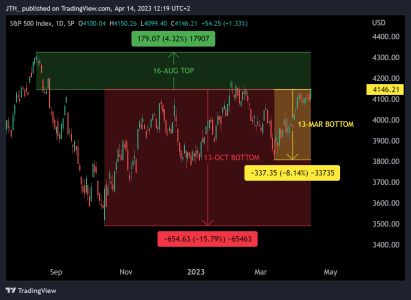
So Thursday we closed at a 23-day high, call me grumpy, I don't like this setup (in terms of TSP). Since I'm currently on the sidelines, it's better for me to watch this play out.

Risk Vs. Reward shows a 4.32% reward to see the Aug top, -8.14% risk to see the March bottom, & -15.79% risk to see the October Bottom. From this perspective I see this more as overpriced, where current levels make for a better exit than entry.
20230414.png


__
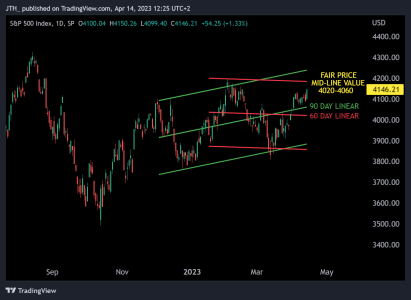
From a different perspective, here's a red 60-Day declining linear channel with a mid-price of 4020, and a green 90-day rising linear channel at 4060. At our current 4146, we are over priced with 2 to 3% downside risk to the mid lines, vs. 1 to 2.25% upside reward to the upper standard deviation 2 lines ranging from 4185-4240.
20230415.png
 
Re: MONTHS

Good morning soapbox

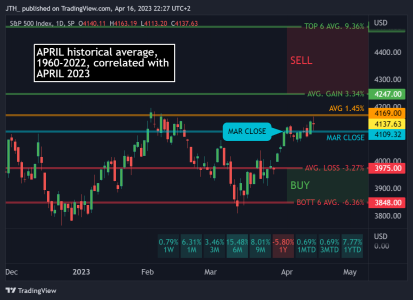
Sell in May and go away (not). Just a word or caution, the worst 6 months of the year start in May, but given our current levels, it's possible the market movers will front-run and sell off before May even begins. In 2022, the -17% dump ran from late March to mid May, then dumped some more into June. 2020-2021 were great, but 2019 dumped -7.63% in May.


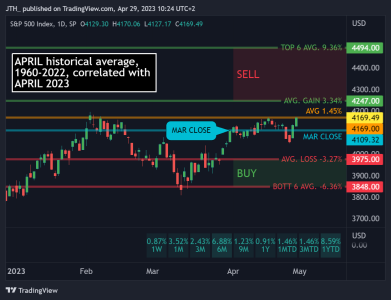
Anywho, thus far about halfway into April has been flat, we are up .69% for the month, and have yet to reach the 1.45% historical average projected at 4169.
20230414-STAT-M.png

___
On the AutoTracker, little has changed for the Top-600, but in the Top-50, the G/F Funders have been squeezed out (losing a 14% allocation), while the I-Fund has risen to 50%
20230414-AT.png

___
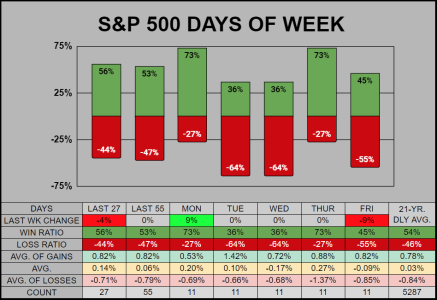
For the Day of Week stats, Monday & Thursday are pops with a 73% win ratio, while Tuesday & Wednesday drops with a 36% win ratio. The last 4 Mondays are up, last 3 Tuesdays down, last 5 Thursdays are up.
20230414-DoW.png

Happy tax day....
 
Re: MONTHS

Good morning (All hail Tech)

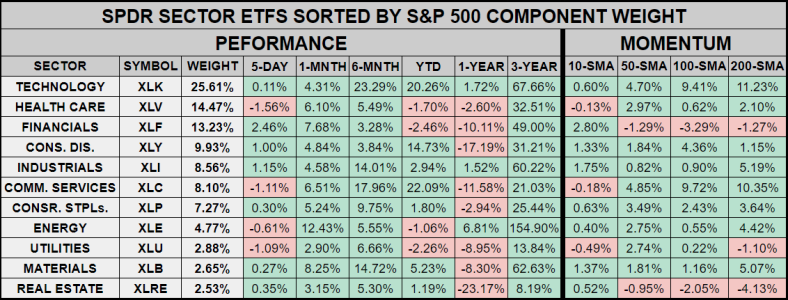
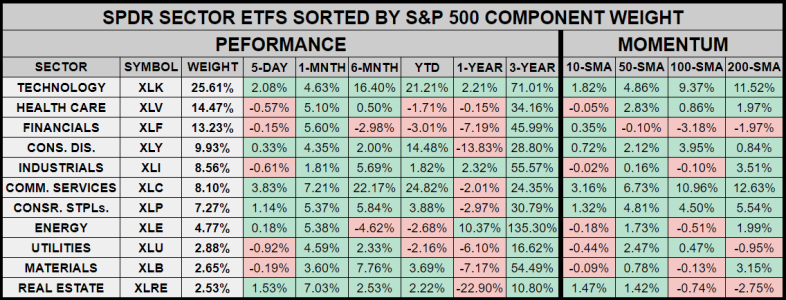
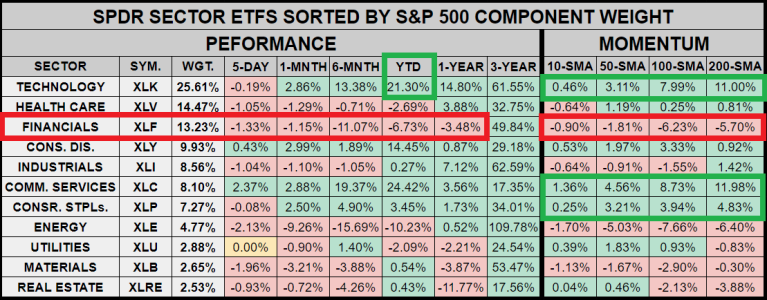
Here's a different perspective on the health of the S&P 500 based on sectors and the weighted SPDR ETFs. We can see the XKL Technology ETF has the largest weight at 25.61%, it is also performing above all timeframes and key moving averages.

SECTOR.png
 
Re: Last Week of the Quarter

Happy Friday I Fund

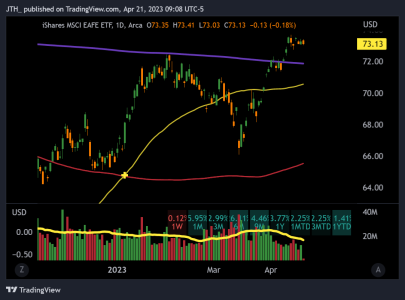
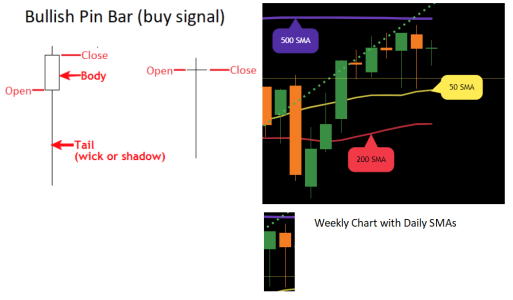
My own personal line in the sand is the Daily 500-SMA (in purple) and EFA is trading above it. Adding to this, the USD is at a 50 day low, adding a nice tailwind.

EFA.png
 
Rotation

Good morning to rotation

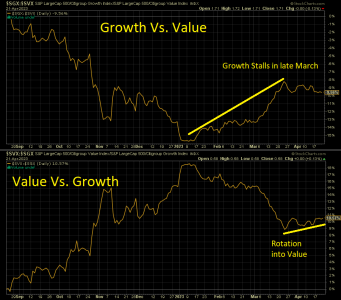
It's always 5 o'clock somewhere. This past month, there's been a rotation with Growth & Value. From YTD to late March, on the top half of the chart we can see the rise in growth. From late March onward, the bottom half shows the rotation into value.

$SGX LargeCap Growth Index (Info Tech % Healthcare comprise 52.6% of the Index), $SGX:$SVX, $SVX LargeCap Value Index (Finance & Info Tech comprise 36.5% of the Index)

20230421-VS.png

___
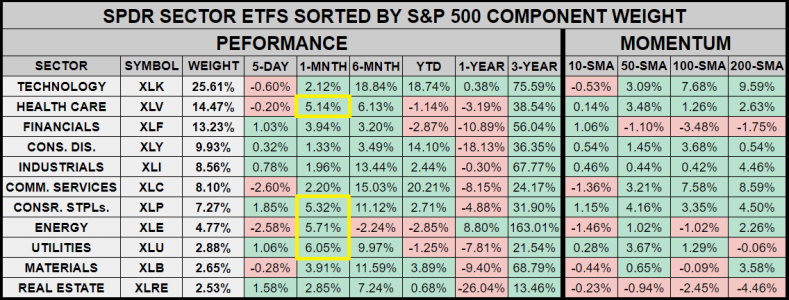
More on rotation. As for the SPDR Sectors, over the past month, Healthcare, Consumer Staples, Energy, & Utilities are performing well.
20230421-SPDR.png
___
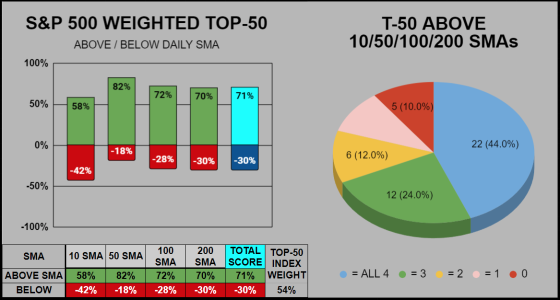
For the S&P 500's weighted Top-50 (54% weight of the index) we have 22 of 50 trading above all four key moving averages, and only 5 trading below all four. Those numbers look great, but are we getting toppy?
20230421-T50.png

___
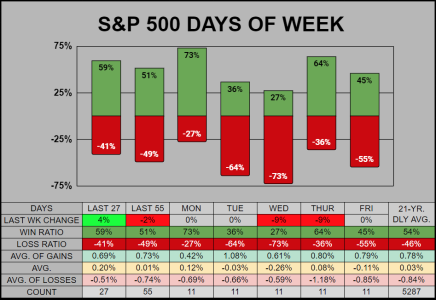
The Day of Week stats are similar to last week, Mon/Thur are great, Tue/Wed blow chunks.

The last 5 Mondays have closed up, & last 8 of 9 have closed up.
20230421-DoW.png

___
For the AutoTracker's Top-600 & Top-50, very little has changed from the pervious week.
20230421-AT.png

Have a great week!
 
Re: MONTHS

Good morning

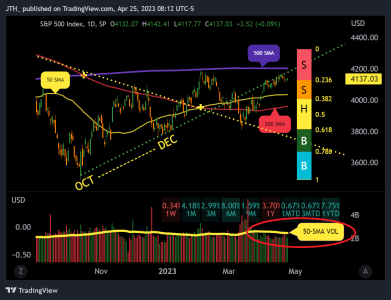
Across the past 20 trading sessions, we've have low volume below its 50-SMA Volume. My guess, when volume does decide to ramp up, then we'll see these markets pick a decisive direction. I for one, would love to see some volatility...

20230421-VOL.png


Re: MONTHS

Good morning to being just average (post 1 of 3)

Closing out the month, here's a review of the historical projections for the month of April, Quarter 2, and 2023.

If you recall:
From the Previous 63 years, "roughly speaking" April is the 3rd best month:

-- Has the 2nd best win ratio
-- The 5th best average of all positive gains
-- The 2nd best average of all closes (positive and negative)
-- The 5th best average of all negative closes

From the chart below, the historical projection for April's average price was 4169 or 1.45% . This April closed at 4169.49 at 1.46%, and ranked as 29th best of 64 Aprils.
SPX DAILY
20230428-STAT-M.png

___
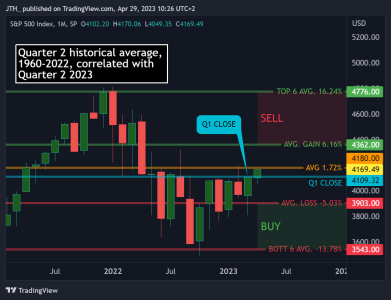
Moving unto the Quarterly projection, QTD is 1.46%, sitting just 10 points under Q2's 1.72% historical projection at 4180.
SPX MONTHLY
20230428-STAT-Q.png


___
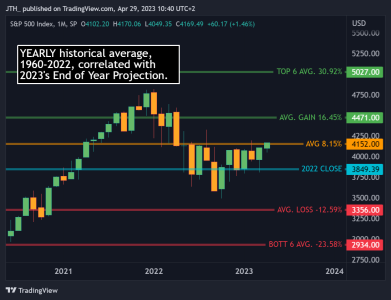
Lastly, for 2023's yearly historical projection, we are currently 8.59% YTD, just above the 4152 8.15% projected average.
SPX MONTHLY
20230428-STAT-Y.png

___
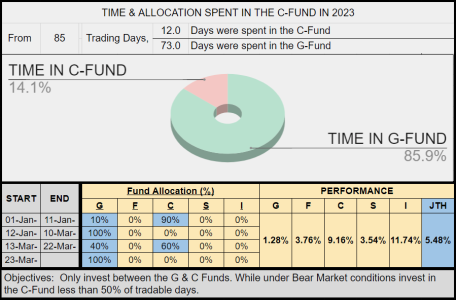
REPORT CARD: For myself, the month was spent in the G-Fund. Thus far, of 85 days, 12 have been in the C-Fund. While I'm definitely underweight equities, I think there will still be some opportunities to get back in on the next dip. As previously mentioned, my own personal line in the sand is the 500 SMA, anything below this average, keeps me guarded.

Of the 4-horsemen (Transports / NASDAQ / S&P 500 / IWM Small Caps) all are trading below the 500 SMA.
Of the 11 SPDR ETF sectors I trade, 6 are below the 500 SMA. To be fair, many of these indexes and sectors are above their 200 SMA, so it's not all doom and gloom, it would seem it may take some time (years) to get back into full-on bull mode.
20230428-JTH.png
 
Good morning to the Month of May (Post 2 of 3)

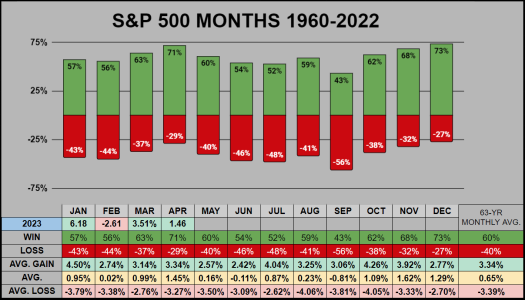
A previous edition of the Stock Trader’s Almanac states the worst 6 months of the year begin in May. From my own data, across 1965-1984 the Month of May closed down 15 of 20 times. But in the last 10 years, May only closed down once in 2019.

From the Previous 63 years May "roughly" ranks as the 9th best month:
Of the 12 months of the year, the month of May
-- Has the 6th best win ratio
-- The 11th best average of all positive gains
-- The 9th best average of all closes (positive and negative)
-- The 8th best average of all negative closes
20230428-12MNTHS.png


___
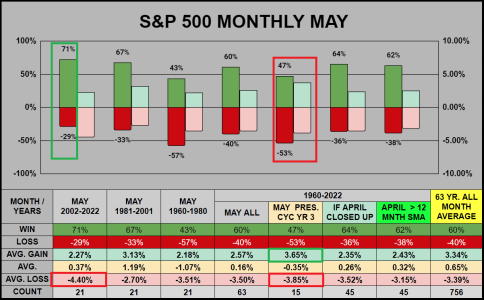
Digging deeper, we can see the past 21 years have a strong 71% winning ratio, but also the weakest Avg. of all losses at -4.40%. In Presidential Cycle year 3, (only 15 points of data) we have a weak 47% win ratio, with the strongest Avg. of all gains at 3.65% which is contrasted by the 2nd weakest Avg. of all losses at -3.85%
20230428-MAY.png


___
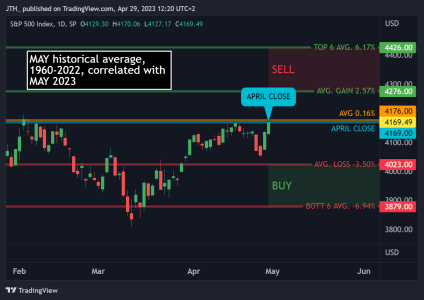
For our projections, all 63 Months of May average out to just .16%. Based on April’s 2023 close and May’s past statistics, we should be looking to buy under 4023 & sell above 4276, which is essentially a 6% price swing.
SPX DAILY
20230428-STAT-M-MAY.png

Thanks, and have a great month!
 
Good morning (post 3 of 3)

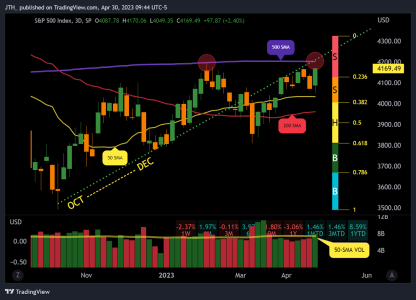
Here’s a 3-day chart with Daily SMAs. I’ll be interested to see if we re-test the 4200 swing high from 2-Feb, where there was also a rejection at the 500 SMA. At this time, the 500 SMA intersects with the OCT-DEC trendline (an area of both support and now resistance). If we can push through this level, then the next test could be the Aug high, which would be a significant achievement.

SPX 3-DAY
20230428-3-Day.png

___

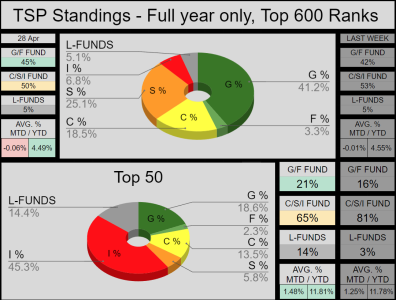
For the AutoTracker’s Top-600 it was a flat week, and collectively we closed out the month with a -.06% loss. As for the Top-50, there’s been a recent invasion of L-Funders, but the I-Fund retains its majority, and the Top-50 closed out the month up 1.48%

20230428-AT.png

___
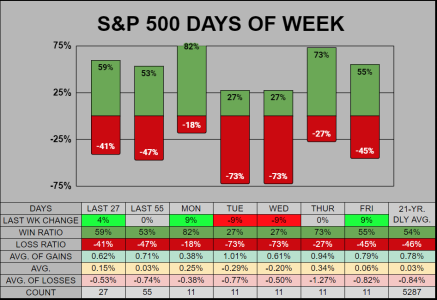
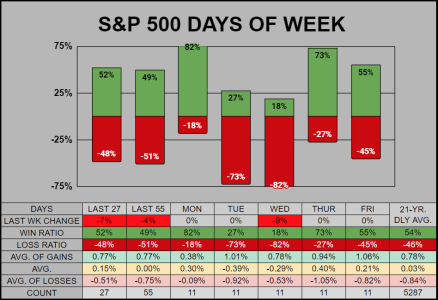
Across the Day of Week stats, it’s much the same picture that it was the previous 2 weeks. Mon/Thur good, Tue/Wed bad, & Fri is average. The last 6 Mondays have closed up, and the last 4 Wednesdays have closed down.

20230428-DoW.png

___
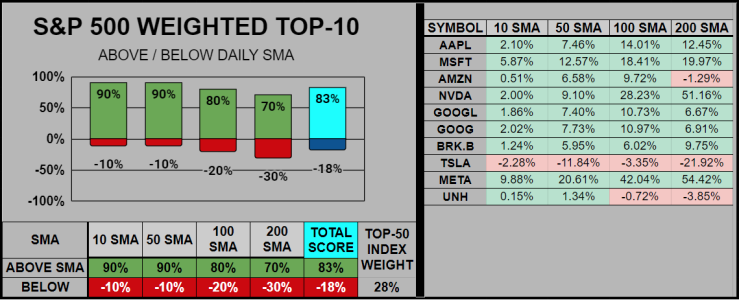
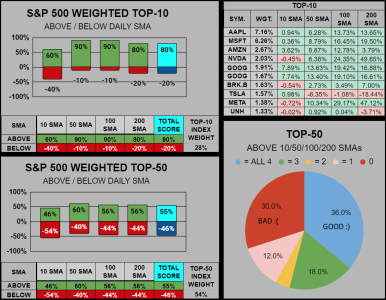
Normally I’ll do the S&P 500’s weighted Top-50 components which comprises 54% of the Index. Changing things up, this week it’s the Weighted Top-10, making up 28% of the index. Only Tesla is sucking wind, while the others are doing quite well.
20230428-T-10.png

___
Looking at the SPDR Sector ETFs, we can see Tech’s XLK (25.61% of the S&P 500), is firing on all cylinders both in performance across all timeframes, and momentum across all moving averages. Meanwhile it’s Healthcare & Financials (a combined 27.7% of the index) which has been tamping us down, but they did have a good month.

20230428-SPDR.png

All the best for May :smile:
 
Good morning

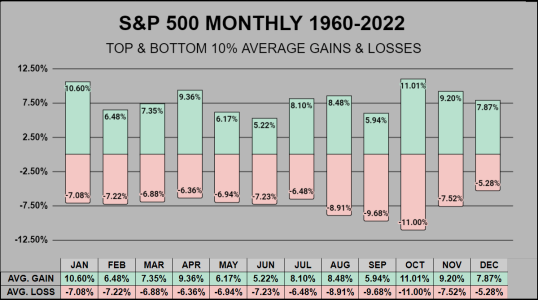
Since May is the supposed beginning of the "Worst 6 months of the year", I thought I'd take a look at the outer extremes of monthly gains & losses.

The best month across 63 years was October 1974 gaining 16.30%
The worst month across 63 years was October 1987 losing -21.76%

This chart takes the top & bottom 10% for each month across the previous 63 years (or 756 months). In terms of extreme gains & losses, October is the clear winner/loser here.

T6B6.png

___
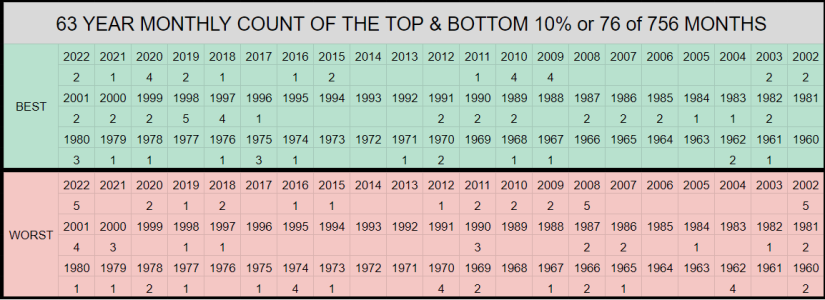
Breaking this down by year & monthly count, we can see the pockets of strength and weakness as they aligned with the bull/bear movements in the stock market.

T6B6-1.png
 
Re: MONTHS

Good morning


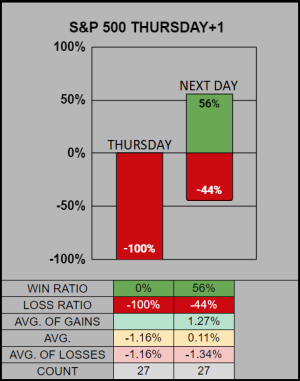
Based on historical data, it looks like today will have a positive close. If for some reason it doesn’t close up, then (for myself) I’d take that as a warning sign.


From last week’s Thursday, the last 27 times Thursday closed down, the next trading day had a 56% winning ratio.

20230505-+1.png

___
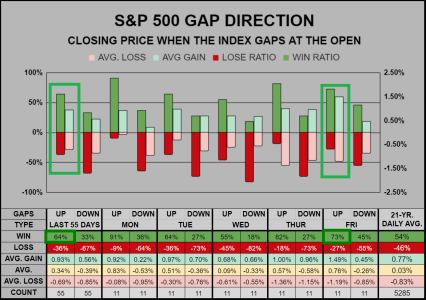
From last week, across the past 55 trading sessions, when the S&P 500 gaps up at the open, the close has a 64% winning ratio. Of the last 11 times Friday gapped up, it closed up 73% of the time.

20230505-GAP.png

___
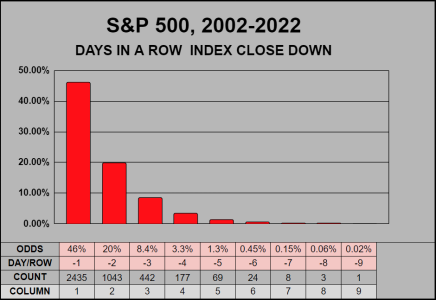
On Thursday, the S&P 500 closed down 4 consecutive days. From the previous 21 years, a 5 consecutive day close down has happened 1.3% of the time.

20230505-ROW.png

___
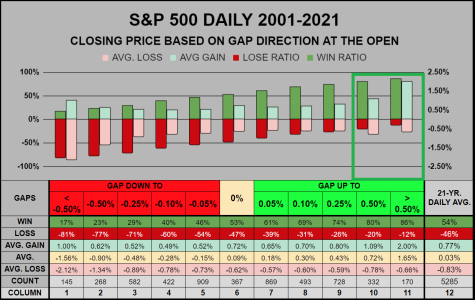
From the previous 21-years, when the S&P 500 gaped up at the open .50% or greater, then the index closed up 80-86% of the time.

20230505-21-GAP.png
 
Thanks, I'm fortunate enough that the pre-markets open for me at 10am. Sometimes watching the pre-action gives a good feel for how the markets will behave in the open. On a good day, I've already bought in the pre, and sold in the 1st hour of trading, and I'm done for the day.

The last 2 weeks have had long tails, so I feel like buyers are still in control. I'll be curious to see what happens next week.

You and me both. :scratchchin:
 
Re: MONTHS

Good morning


Perhaps a slight word of caution, Crypto BTC/ETH pulled back this weekend, when compared with the S&P 500, they have a much lower high (compared with the previous high). It might mean nothing, but it could also mean that money flows into speculative assets is drying up.


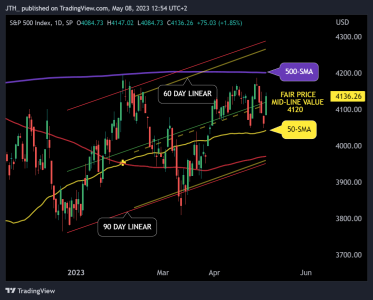
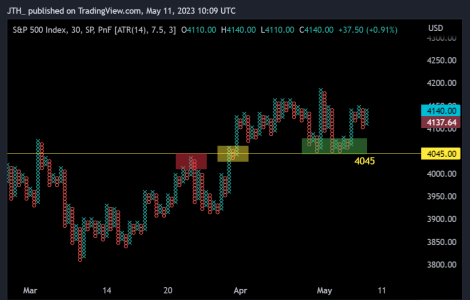
Looking at the 60/90 Day Linear Regression Channels, we are fairly priced just above the 4120 Mid-value lines. Both channels are in agreement with their spacing & angles, so it looks healthy. We could be setting up for a 50-SMA 4040 to 500-SMA 4200 trading range, which is roughly a 4% price swing. When I see something like this, I think of the compression of prices, the more time we compress, the more exciting it will be when we break into the next level.

20230505-60_90.png


__

On the Day of Week stats, it’s much the same picture as it was the previous 3 weeks. Difference being, Mon/Thur have gotten better, while Tue/Wed have gotten worse, with Fri still sitting at average. The last 2 Tuesdays & 5 Wednesdays have closed down, while the last 3 Fridays have closed up.
20230505-DoW.png

___


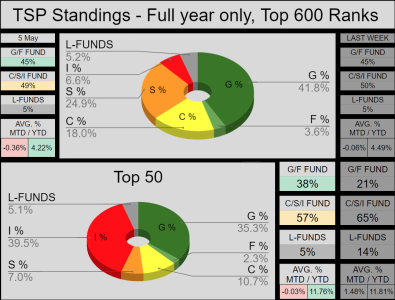
For the AutoTracker’s Top-600, little has changed. It was a flat week, losing -.27%. For the Top-50, there’s been a 17% increase in the G/F Fund allocations, with this week’s Top-50 losing -.05%

20230505-AT.png


___

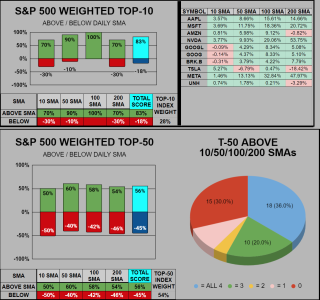
On the S&P 500’s weighted Top-10, the short-term 4-day pullback didn’t dig us too deeply under the primary SMAs, but it did pull the Top-50 down to reasonable levels.
20230505-T10.png

have a greet week!
 
Re: MONTHS

Good morning (Post 1 of 2)

Using Fuzzy Math, by weight, the S&P 500's Top-10 have contributed 8.69% YTD. Since the index is up 7.41% YTD, this should mean that without the Top-10 the index would be down -1.28% YTD.

Another way to look at it, 2.35% of the S&P 500's 7.41% YTD performance comes from AAPL. Although AAPL has a 7.16% index weight, it has contributed 31% of the S&P 500's YTD gain.

___
The SPDR Sector ETF XLK carries an index weight of 26%, a gain of 21.30% YTD, and is trading above the 10/50/100/200 SMAs.

20230512-SPDR.png
___
With the exception of TSLA, the weighted Top-10 stocks are performing well, with the Top 3 trading above all the major SMAs. Meanwhile the weighted Top-50 look flat-to-average.

20230512-T-50.png


Back
Top