JTH's Account Talk

Wait... what? :1244: So, Wednesday was up, and now Friday is up, barely, with no gaps... At resistance at the moment, maybe we punch through on light volume? Not much time left. Worst case we're at a mini double top and we lose some ground next week. Not much I'm thinking as consumers should be out consuming. :nuts:
 
So what do they say about patterns? - as soon as you identify one it changes? But, it looks like for the S&P 500, Friday went opposite (slight drop at close) Wednesday (barely) as the trend had been. But barely. So I decided to hold on to my C shares to see if Monday follows the S&P 500 trend identified in the "Thanksgiving 2011 to 2021" chart that showed when the Friday after Thanksgiving was down, the following Monday went up by over 1% all but one year (2013). Here's hoping for a big Monday :) Good luck to all and have a great weekend.
 
Thanks, those are all great points, and ya know the holiday weeks always mess with my statistical mojo.

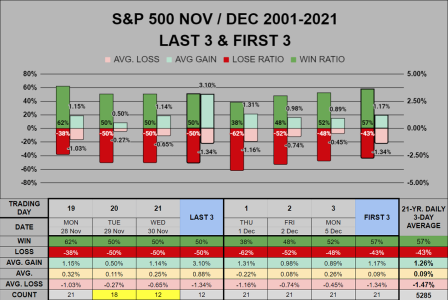
Last 3 of NOV vs. 1st 3 of DEC. It doesn't look all that great to me, in 2021 the last 3 of NOV lost 2.86% but it's stats, they love to prove me wrong :)


3+3.png
 
So what do they say about patterns? - as soon as you identify one it changes? But, it looks like for the S&P 500, Friday went opposite (slight drop at close) Wednesday (barely) as the trend had been. But barely. So I decided to hold on to my C shares to see if Monday follows the S&P 500 trend identified in the "Thanksgiving 2011 to 2021" chart that showed when the Friday after Thanksgiving was down, the following Monday went up by over 1% all but one year (2013). Here's hoping for a big Monday :) Good luck to all and have a great weekend.

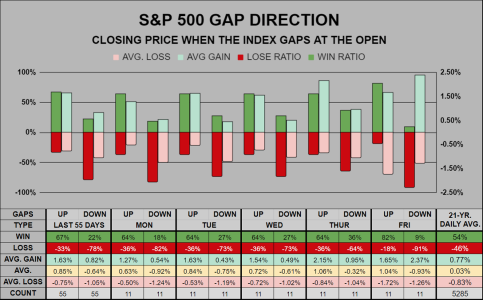
The daily stats are sometimes useful (for me) to determine what edge I can go for when using an IFT. I think the gap stats are better than the day of the week. Aside from that I'd rather look out to the Monthly & Quarterly stats and the larger moving averages.
 
Based on this data, a gap down on Monday might be a good time to buy, while a gap up on Friday might be a good time to sell.

Good afternoon

The Gap history is largely unchanged, for all days combined, I've decided to go back a full 55 days (instead of 21) to match the Day of the week chart. Of the last 11 Fridays that gapped down, 10 closed down.

20221127-GAP.png
 
Good morning

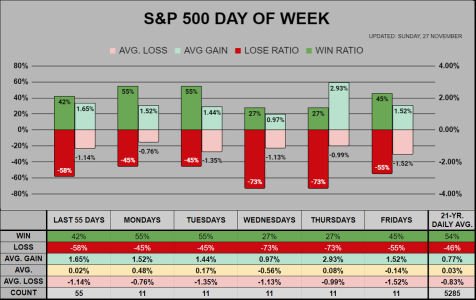
Not much to report for the Day of the Week stats. Wednesdays & Thursdays have been the the poorest performers, so perhaps it's time for them to show a rebound or at least equalize with the daily statistics.

20221127-DoW.png
 
Good morning

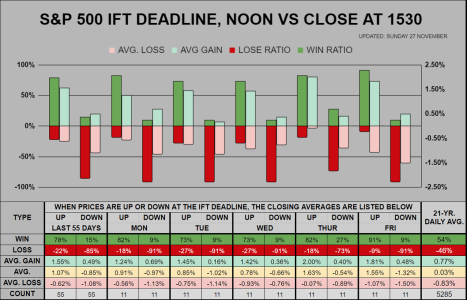
The good news, if you punch in an IFT close to the noon deadline, you have a great chance of getting a closing price in the same direction as the noon deadline.

With a 91% win ratio and 1.81% avg. gain, Friday has historically been the best day to sell. Amazingly enough, it's also been the best day to buy.


20221127-IFT.png
 
Interesting information and perspective. Thank you !!! :notworthy:

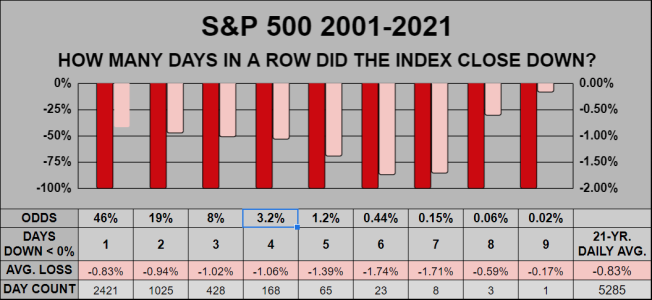
Thanks Eric, I love to sort and crunch these numbers, it's somewhat relaxing for me. This Tuesday marked the 3rd concurrent close down. In the previous 21 years, this type of event happened about 8% of the time. Technically speaking this statistic should be more like flipping a coin, but for fun we can suppose that the odds of SPX closing down 4 days in a row is about 3.2%.

20221127-ROW-.png
 
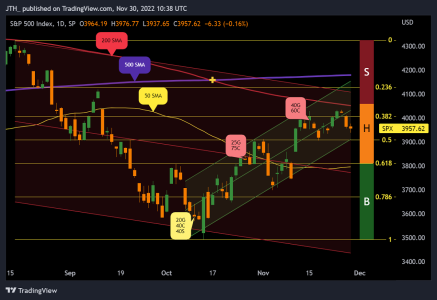
Well, as we finish out the month, I'm in a holding pattern with one remaining IFT which will likely go unused. On Tuesday I tried to look for reasons to enter, but could not find a compelling enough reason to take the re-entry and buy more. I don't like starting off the next month knowing my next entry is more likely to be a buy vs. a sell, but it is what it is. But, if we take a nice dip in the 1st week of December, then i will feel much better about my decision :)

20221130-CHART.png
 
Good morning (3rd post today)

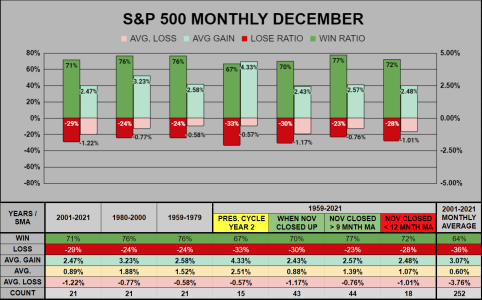
As we close November out, we now have December and the joy this fabled month brings us. If you look to the far right bottom corner we can see the 21-year all months average win ratio is 64% and December has been above this average across various timeframes & conditions. All the best, as we finish out the year!


View attachment 56362
 
Good morning

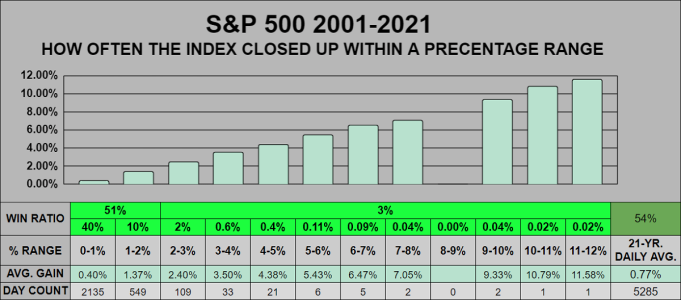
What an amazing finish for November, closing the month 5.38% and closing at the highs, finishing with a 3.10% daily close.

From the previous 21 years, we can see SPX closed up 3-4% about .06% of the time, this happened 33 times across 5,285 trading days.

20221127Gain.png
 
JTH - LOVE these graphics! I didn't realize how many times there were single day jumps this large. Since buy and hold folks often cite to the statistics about "missing the 10 biggest days" I wonder if there are any patterns for these BIG move days (over 3%)? Do they usually occur on a particular day of the week, or mostly in fall months, etc? Glad I was largely in for yesterday and looking like I may stay for the December joy. Thanks again!
 
JTH - LOVE these graphics! I didn't realize how many times there were single day jumps this large. Since buy and hold folks often cite to the statistics about "missing the 10 biggest days" I wonder if there are any patterns for these BIG move days (over 3%)? Do they usually occur on a particular day of the week, or mostly in fall months, etc? Glad I was largely in for yesterday and looking like I may stay for the December joy. Thanks again!

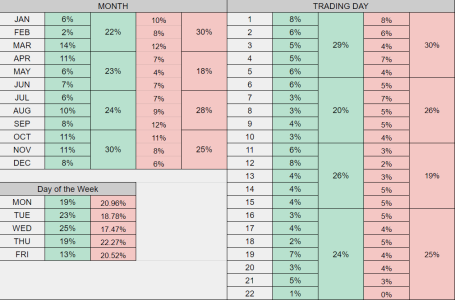
Thanks, it's a bit difficult to quantify and I don't have an engine for back-testing. During those 21 years, If we took the best 180 days > 2% and worst 229 days < -2% this is how these days look. These are not percentage gains listed, just where those days fall on the timeframes.

Overall the last 3 months have the most good days, while the first 3 have the most bad days. For the trading day of the month, the 1st 5 days and last 7 are in a dead heat. For the day of the week, TUE/WED looks good, FRI looks the worst.

I've been thinking of setting aside some funds for statistical investing next year in my brokerage account, it would be fun, but I haven't setup a rules based system yet.


20221127-BEST & WORST.png
 
Last edited:
JTH, great charts. One favor though. Could you make the non-chart information font a little larger.
 
Back
Top