jpcavin's Account Talk

Almanac Trader

"Patience is still in order. We are getting ready for our perennial Best Six Months Seasonal MACD Buy Signal, but there is no rush. The market is still reeling from the recent selloff and the technical and fundamental picture is not yet so favorable. Fundamentals may not improve so much over the next six months, but technical market indicators likely will – at least over the short and intermediate term.
While we anticipate a fourth quarter rally, new highs will be hard to come by. Seasonality has been rather helpful this year. We have been cautious since the spring and on the sidelines for the most part since our June 4 NASDAQ Best Eight Months MACD Sell Signal. The carnage that occurred in the worst two months (August and September) is nearing the end, though it does not appear to be over just yet.
In the meantime the Three Peaks and a Dome House Top Pattern (3PDH) we have been tracking since last October, has run its course. This is not to say that the market will not go any lower, but by definition it has reached its minimum low which corresponds to the separating decline low of last October at points 10/14. In the chart below of the 3PDH we have also drawn the pending set up of a “W” bottom pattern or a 1-2-3 swing bottom formation (Our good friend John Person schooled us on this pattern several years ago.) A break above the mid-September high around DJIA 16750 would be bullish."
 
Martin Pistorius: How my mind came back to life

Imagine being unable to say, "I am hungry," "I am in pain," "thank you," or "I love you,” — losing your ability to communicate, being trapped inside your body, surrounded by people yet utterly alone. For 13 long years, that was Martin Pistorius’s reality. After contracting a brain infection at the age of twelve, Pistorius lost his ability to control his movements and to speak, and eventually he failed every test for mental awareness. He had become a ghost.

Amazing story. Watch the video when you all have time.
 
Almanac Trader

Unlike last year’s late Q3/early Q4 market swoon, there was no sharp “V-bottom” this time. Instead the market appears to be forming a “1-2-3” or “W” bottom. Thus far, the retest of the August’s low has been a success. Now the market will need to climb above its mid-September highs.
 
Almanac Trader

"Although the market did take a breather today, (6-Oct) it is still on course to trace out and likely complete a “1-2-3” or “W” bottom formation pattern. The market also afforded us an opportunity to close out defensive positions in the Almanac Investor Stock and ETF portfolios and add new long exposure at better prices than available yesterday when we issued our Seasonal MACD Buy Signal.

As has been the case more often than not over the past 65 years, the market did stumble during this year’s “Worst Four/Six Months.” From our April 30 Seasonal MACD Sell Signal for DJIA and S&P 500 through yesterday’s(5-Oct) Seasonal MACD Buy Signal, DJIA was down 6.0% and S&P 500 was off 4.7%. NASDAQ’s Seasonal MACD Sell Signal was on June 4 and it was off 5.5%. The naysayers will still call this year a fluke, but DJIA’s and S&P 500’s high year-to-date was in May while NASDAQ managed to eke out a slightly higher high in July. We call this year a resounding success for “Sell in May” and our Seasonal Switching Strategy.

Looking ahead to the rest of the year, seasonal patterns are aligning for a potentially robust yearend rally. There has not been a down DJIA pre-election year since 1939. Historically, a down August followed by a down September has preceded sizable Q4 gains. The fourth quarter is also the most bullish quarter of the year (page 102 of 2015 STA). Market sentiment is no longer excessively bullish while fundamentals are mixed just enough to support a Q4 rally as expectations for an improving economy in 2016 likely begin to gain traction.

Market volatility, measured by CBOE VIX is still somewhat elevated suggesting a few more wild daily swings are more than just likely. Buy limits and stop losses in the Almanac Investor Stock and ETF Portfolios have been selected with the goal of using any volatility to our advantage while establishing new long positions on dips and avoiding the dreaded whip saw stop loss once purchased."
 
Almanac Trader
[h=2]
tumblr_inline_nvvfo8aSkc1spdppr_500.jpg
[/h]Spring’s Rally in the last 21 years has averaged a 13.2% gain as measured from the low in February or March to the second quarter closing high. Fall, measured from the low close in August or September to the high in the fourth quarter saw DJIA climb an average 12.3% followed by winter with 12.2%. Last and least was the average 8.8% summer rally. Based upon the average Fall Rally, DJIA could be closing in on 18,000 sometime later this fourth quarter.


Impressive S&P 500 gains from Halloween to Christmas

tumblr_inline_nvx633tDNA1spdppr_500.jpg


“Massive S&P 500 Gains Halloween to Christmas” is the largest dollar amount winning trade last featured in the Commodity Trader’s Almanac 2013. It now has a cumulative profit of $289,338 per single futures contact over the last 33 years including most recent data. This trade is obviously linked to the beginning of the “Best Six Months” of the year as detailed in the Stock Trader’s Almanac 2015. Going long the S&P 500 near the end of October and holding until just before Christmas has been successful 25 of the last 33 years, or 75.8% of the time. The average move during this trade’s timeframe has been 4.2% since 1982. Seasonal strength is shaded in yellow in the second chart below.

tumblr_inline_nvx64w8Otn1spdppr_500.jpg

Choices to execute this trade are numerous: full futures contracts, the e-mini electronic futures or a handful of ETFs such as SPDR S&P 500 (SPY) or Vanguard S&P 500 (VOO). SPY has the longest track record, the most assets and is the most heavily traded ETF making it a top choice. VOO’s main attraction is a net expense ratio of just 0.05%. Having issued our Seasonal MACD Buy Signal on October 5, exposure to this trade already exists in the ETF Portfolio, however this shorter-term stands to reinforces the importance of using any October weakness to enter new long positions. There have been just two losses in the past twelve years. Not a perfect track record, but certainly a high probability trade setup worthy of consideration.
tumblr_inline_nvx65pGHs81spdppr_500.jpg


Almanac Trader

[h=2]October options expiration generally bullish, but no stranger to volatility[/h]
tumblr_inline_nvz0o0vFZc1spdppr_500.jpg
Since 1994, the Monday of options expiration week has a bullish bias for DJIA, S&P 500, NASDAQ and Russell 2000. Expiration day however, tends to be mixed with average losses across the board even though S&P 500 and NASDAQ have advanced more often than not. Entire expiration week and the week after also lean bullish. Of note is the small-cap index streak of 13 straight advances from 1994 through 2006 (not shown, the streak is actually 17 years starting in 1990) and it has been down in five of the last eight years. October’s reputation for volatility can be seen with wild daily and weekly swings in the tables below. Weekly moves in excess of 5% occurred in 1998, 2002, 2008 and 2011.
tumblr_inline_nvz0otYyuR1spdppr_500.jpg
tumblr_inline_nvz0oz4eu11spdppr_500.jpg
tumblr_inline_nvz0p519Gw1spdppr_500.jpg
tumblr_inline_nvz0pbU8bQ1spdppr_500.jpg
 
Almanac Trader

NASDAQ needs to catch up for rally to have legs


After putting up its best week of the year, the market is taking a pause to consolidate recent gains and evaluate earnings reports. For the week ending October 9, S&P 500 was up 3.3%, Russell 2000 gained 4.6% and DJIA was up 3.7% (second best of 2015). Technology was the laggard last week with NASDAQ advancing just 2.6% (seventh best week of 2015). Thus far, our Seasonal MACD Buy Signal issued after the close on October 5 has proved timely. We entered new long positions associated with our Best Six Months Switching Strategy during weakness last Tuesday and were rewarded with a fair portion of last week’s advance.


tumblr_inline_nw6i5hlIJZ1spdppr_500.jpg
tumblr_inline_nw6i5tuxHy1spdppr_500.jpg
tumblr_inline_nw6i656LHL1spdppr_500.jpg


DJIA and S&P 500 have broken through resistance at their rapidly descending 50-day moving averages (solid magenta line), but NASDAQ came up short during the recent rally. For this rally to resume we are looking for DJIA and S&P 500 to hold above their respective 50-day moving averages or at worst dip and/or close just slightly below and for NASDAQ to “catch up”. Without NASDAQ leading the rally, a robust fourth quarter performance will become even more challenging for the market
 
Last edited:
Great summary Cougar! Let's see how the earnings shake out. Wal-Mart isn't providing that Dr. Feel Good mojo I was hoping for. Hopefully some of the big dogs will have better things to sAY.

fs
 
I don't keep up with all that stuff...gives me a headache when I try to make sense of it. :laugh: I'm just crossing my fingers NASDAQ hits 4817.12 :sick:
 
Almanac Trader

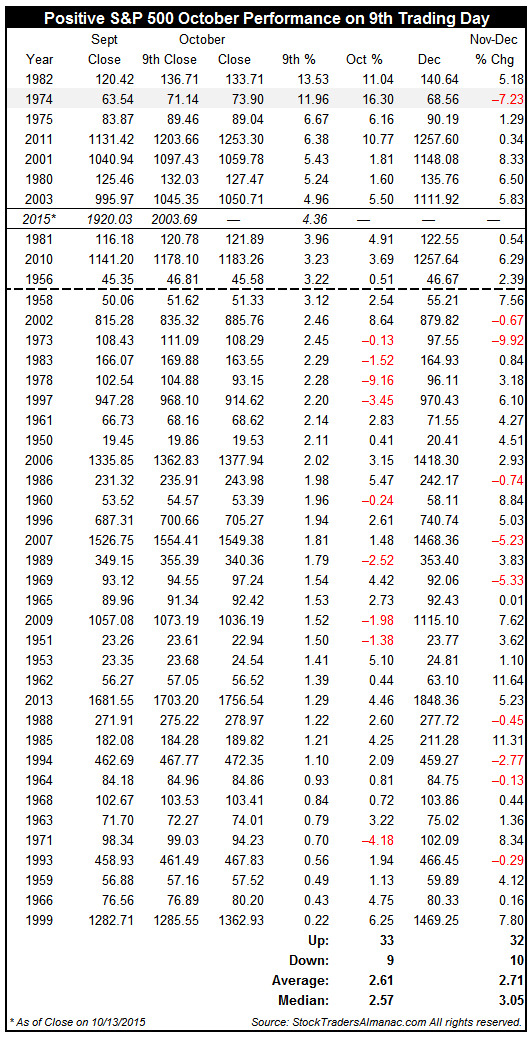
[h=2]8th Best S&P 500 October start since 1950[/h]At yesterday’s close, the ninth trading day of October, S&P 500 was up 4.4% for the month. This is the S&P 500’s best October start since 2011 and good enough to be the eighth best start since 1950. Even factoring in today’s loss, S&P 500 is still in the Top 10 since 1950. Historically when the first nine trading days of October produced a gain, full month October finished with a gain 78.5% of the time and November and December combined were positive 76.2% of the time. Twenty-three of 42 past early October gains (54.8%) held and grew by month end.

tumblr_inline_nw8afths6p1spdppr_1280.jpg
 
Yeah...you gotta wonder where all the doom-and-gloom/black-swan talk from the talking heads is coming from? My equity model has-been, and is, bullish.

Almanac Trader

8th Best S&P 500 October start since 1950

At yesterday’s close, the ninth trading day of October, S&P 500 was up 4.4% for the month. This is the S&P 500’s best October start since 2011 and good enough to be the eighth best start since 1950. Even factoring in today’s loss, S&P 500 is still in the Top 10 since 1950. Historically when the first nine trading days of October produced a gain, full month October finished with a gain 78.5% of the time and November and December combined were positive 76.2% of the time. Twenty-three of 42 past early October gains (54.8%) held and grew by month end.
 
I was doubting myself for staying in but this article reminded me of one of BT's favorite quotes, "Be right and sit tight."
 
Almanac Trader

Recent inflation data is something to be concerned about, although it is something of a double-edged sword as the lower it goes, the lower inflation expectations go and the less likely the Fed is to raise rates. The Fed meets again later this month and it would be absolutely shocking for them to make any move this month. Actually, it would be surprising if more than ten words are changed from September’s statement. Recent jobs market data has softened, notably average hourly earnings. This combined with the recent plunge in the Consumer and Producer Price Indices (CPI & PPI) suggest the Fed might actually have to take rates negative.

tumblr_inline_nwa4flyfO51spdppr_500.jpg


To put recent inflation data into perspective, the six-month exponential moving average (EMA) of year-over-year CPI and PPI (not seasonally adjusted) from 1980 to present are plotted above. The solid black line represents the Fed’s “2% target.” Not-seasonally-adjusted data was selected for its purity. There is enough statistical magic in CPI and PPI that adjusting it is just overkill. The 6-month EMA smooths the spikes and valleys in the data series and produces a reliable trend.

As of the most recent September readings, PPI is not that far from its low reached in September 2009 while CPI is on the verge of going negative. It would seem the Fed has just a few options at this point; leave rates alone and wait, consider taking rates negative or possibly more QE. A final possibility could be to just undue several decades of tweaks designed to mask inflation.
 
Almanac Trader

To recap, we issued our Seasonal MACD Buy Signal after the close on October 5. On the following day new long positions in DIA, SPY, QQQ and IWM were established in the Almanac Investor ETF Portfolio and remaining defensive positions were closed out. We also closed out short stock positions in the Stock Portfolio. On Tuesday of this week we put our proprietary stock selection process through its paces to unearth sixteen new long stock trade ideas. All of our recent long trade ideas can be considered on dips below their respective buy limits. Thus far, the market has been assisting us in establishing these new positions. It has taken a moment to digest its early month gains and the prospects for the balance of the fourth quarter.

Current investor sentiment readings do appear to be setting up in support of a yearend rally. According to Investors Intelligence latest Advisors Sentiment survey, the percent of bullish advisors has rebounded nicely to 36.5% after hitting a multi-year low of 24.7% at the end of September. Bearish and correction advisors are currently at 31.2% and 32.3%, respectively. This is a healthy amount of skepticism which leaves room for the market to work its way higher.
Sadly the current fundamental situation is not a positive, but many of the weak and/or tepid data is backwards looking. For starters, this week’s September Retail Sales figures were a disappointment coming in at a seasonally adjusted rate of just 0.1% when compared to August. Motor vehicle sales were the brightest part of the report and accounted for the gain. Apparently lower fuel prices are helping some, just not as much as many had expected. I suspect the market’s wild ride in September was the largest reason consumers held back, at least partially. Holding onto some additional cash after making a major purchase while the news is full of negative stock market headlines does seem rational.

We are bullish again after spending much of the summer on the defense however, our current bullish stance is not a strong as it was last year at this time or at the start of previous “Best Six Months.” Economic data this time around is mixed at best and borderline gloomy at worst while typical pre-election-year forces have failed to prop the market up this year. Most economic data tends to be backward looking while the stock market tends to look forward. Earnings are expected to rebound next year and the Fed is most likely going to remain accommodative in the face of recent labor market and inflation data. We do expect the market to make a run back towards its recent record highs sometime during the “Best Six Months,” but we do not see a tremendous amount of upside potential after that.
 
Almanac Trader

Why 2016 could be a lousy year for the market

tumblr_inline_nwhk3frLO21spdppr_500.jpg


Prior to President Obama, there have been six previous presidents that served an eighth year in office since 1901; Presidents Wilson (1920), Roosevelt (1940), Eisenhower (1960), Reagan (1988), Clinton (2000) and G.W. Bush (2008). President McKinley was elected to a second term, but was assassinated in his fifth year in office. Eighth years are also presidential election years. In the following chart the one-year seasonal pattern for eighth years is compared to all presidential election years.

tumblr_inline_nwhk4bAzk91spdppr_500.jpg


Eighth years of presidential terms represent the worst of election years since 1920. In eighth years DJIA has suffered an average decline of –13.9%. Out of these six full years, only 1988 was positive. As a result, eighth years have vastly differed from the typical election-year pattern.

How successful is the Almanac Trader?
 
Back
Top