FogSailing's Account Talk

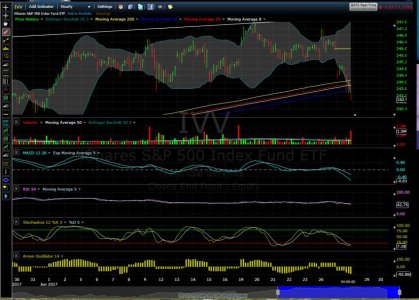
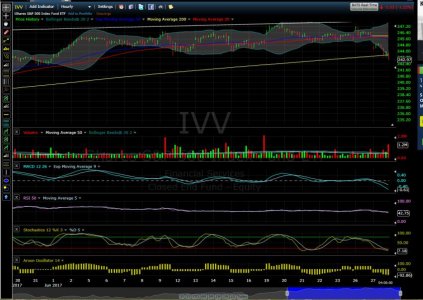
Looks like a case of Tango Uniform. We ended at 2419 and change. If we break below 2419, then 2411, 2385 and 2350 offer the next lines of resistance. The BB widened significantly today. All short term indicators look bearish although long term, things still look bullish. Here's a graphic:

Screenshot 2017-06-27 13.13.20 (2).jpg

FS
 

Attachments

  • Screenshot 2017-06-27 13.05.54 (2).jpg
    Screenshot 2017-06-27 13.05.54 (2).jpg
    92.5 KB · Views: 299
OK. Because this is the last week of the quarter and Bonus Time for Wall Street, the bounce off 2419 tells me that we are moving up in the short term. The Yen is pulling back and CL is ready to rally to pivot $44.88. If we had dropped below 2416-2419, time for Bears to chomp but NOT YET. My guess is that we could have a pullback at 2432 to say 2427-2424 with a reversal into the close. Bullish above 2438 today and i think that's where we're headed.

FS
 
What an interesting week. If SPX exceeds 2454 tomorrow, it's likely to hit north of 2470. But part of me thinks this could be a bull trap. Why, I don't know. Perhaps we because we haven't gone north of 2456 which occurred around June 21st. This market has incrementally moved up since the pullback to 2416 and has sucked in buyers. All the blogs I'm reading are VERY BULLISH. Also the SPX closed above 2438 which is bullish. The Trend Is Your Friend and all that. So, if we pull back, looking at resistance at 2428 and 2411. If we exceed 2456, looks like new ATH's are possible.

FS
 
What an interesting week. If SPX exceeds 2454 tomorrow, it's likely to hit north of 2470. But part of me thinks this could be a bull trap. Why, I don't know. Perhaps we because we haven't gone north of 2456 which occurred around June 21st. This market has incrementally moved up since the pullback to 2416 and has sucked in buyers. All the blogs I'm reading are VERY BULLISH. Also the SPX closed above 2438 which is bullish. The Trend Is Your Friend and all that. So, if we pull back, looking at resistance at 2428 and 2411. If we exceed 2456, looks like new ATH's are possible.

FS
Looks like "part of you" was correct on the drop and bounce to/between resistance levels you mention! Have to start listening to you more. Now what? bounce up & down some, drop or pop?
 
I guess my assessment of the week is that it's been sort of like corrective action :20 down, 20 up, 30 down. But it may have completed for the short term. I'm not seeing anything that says we've cracked resistance for a major pullback. Today is end of quarter and banks have been buying back stocks hence the boost in that sector. Energy has also has a squeeze going on. My guess is that we pull back either today through next Tuesday (possibly to 2406-2380 area) But since it's July 4th week, I'm hoping we see some positive fireworks next week. If it drops below that: 2320 area likely before we rally big once more. The fundamentals are are strong for the long term. AAii sentiment went heavy on neutral. Both bulls and bears are reduced 29% and 26% respectively. So will fear result in a rally. We are due a bigger correction but the market tends to unfold on its terms and time table, not mine.

FS
 
I think tomorrow I'll see the pullback to the 2406 area. Hopefully that's as low as it will go, but 2380 and 2320 are next levels of support if 2406-2440 doesn't hold. Oil should be headed to 42, Gold and the Yen should be headed north. Once the downtrend completes, I think we get a nice July rally before the summer doldrums set in.

FS
 
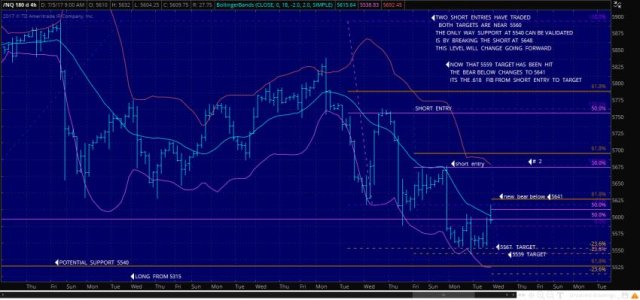
NASDAQ continues to pullback and seems to be leading the pullback. I'm a bear if it goes lower than 5559, the gap below is 5460. That could be where this goes if we don't pivot. Makes me nervous.

FS
 
Looks like the YEN continues to move up, the dollar down. Seems to me that has to reverse. Interestingly, gold is down and it usually moves up if Yen moves up so markets are out of sync? Oil is heading south again after the short squeeze recently. A few data points of concern: RUT 100 and 200 day moving averages are rather close to each other. What does that portend? Also here are some data points from an analyst I follow:

The first is employment growth, which has been decelerating from over 2% last year to 1.6% now. It's not alarming but it is noteworthy that expansions weaken before they end, and slowing employment growth is a sign of some weakening in the current expansion.
The second watch out is demand growth. Real retail sales excluding gas is in a decelerating trend. In May, growth was just 1.7% after having grown at more than 4% in 2015. Personal consumption accounts for about 70% of GDP so weakening retail sales has a notable impact on the economy.

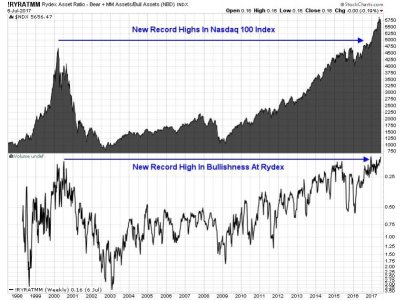
Last is a graphic on the lack of a Wall of Worry:

wallofworry.jpg

All of which tells me that in the short term we go down before we go up. Hope that assessment is wrong.

FS
 
Look at the appreciation on the Yen today and Gold reversed and is moving up. TLT from a low in March of 166 to a high of 128 now sits at 122. Oil has reversed and is now going positive.Nasdaq has decided to go positive. It seems to be leading the trend right now. So if this is a DCB we'll know very quickly. Looks like Bonds are starting to go positive while equity markets are mixed. Hoping that we see a reversal in the Yen. Market forces are readjusting themselves. OK, so where are we headed?

FS
 
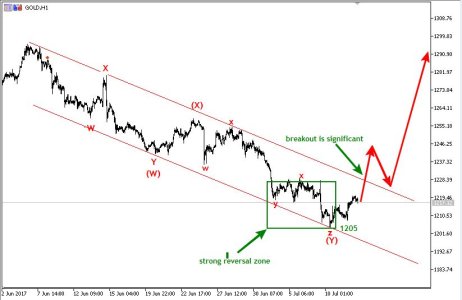
Well, I'm a bull above 2436. Below means it's time to rethink. Here's a potential on a Gold Breakout. Also YEN is still moving northward. Both which say equities would pull back. Keeping my finger on the trigger to move back to G.

Gold-H1-12-July.jpg

FS
 
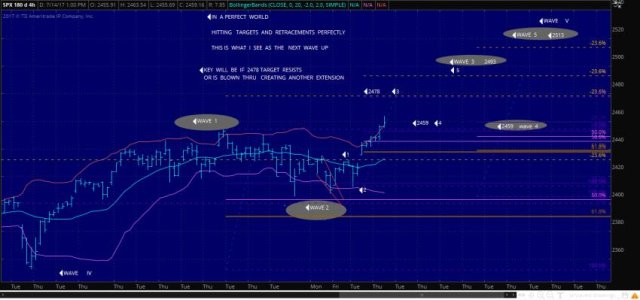
Lots of Bulls out there today. Attached is an EW chart from an analyst I read. He is saying bullish above 2452. Next target is 2465 and if the market is impulsing………then 2478. Should SPX fail and break through 2452, support drops to 2429. Best to all of you this week.

spx71617.jpg

FS
 
My thoughts on TODAY's ACTION...

[video]https://www.google.com/search?rlz=1C2CHBF_enUS728US728&safe=active&site=&source=hp&q=you+tube+video+for+take+the+money+and+run&oq=you+tube+video+for+take+the+money+and+run&gs_l=hp.3..0i22i10i30k1l2.65144.75666.0.76101.43.4 2.0.0.0.0.184.4356.21j21.42.0....0...1.1.64.hp..1. 41.4285.0..0j5j35i39k1j0i131k1j0i20k1j0i131i10k1j0 i10k1j0i22i30k1j0i13i5i30k1j0i8i13i30k1j33i21k1.DY WDXXEyvdA[/video]

FS
 
Back
Top