10/14/25
A lot has happened since my pre-holiday weekend commentary, and because of the holiday yesterday, the TSP fund returns do not reflect yesterday's rally, but rather Friday's bearish market action. The TSP will combine Monday's returns with Tuesday's when posted later tonight (Tuesday.) The index charts below are from Monday's price movement.
If you missed it, stocks were crushed on Friday after comments from President Trump regarding China's tariffs, but over the weekend it was played down some, causing stocks to bounce back yesterday. I don't think that battle is quite over yet so I expect volatility to continue for a little while longer.
Just looking at the gains in gold and silver recently, and yesterday alone where gold was up $125/ounce yesterday and silver pushed above $50 for the first time since 1980, I have been wondering what is going on. Why are investors, governments, and Central Banks racing into the safety plays of these precious metals?
I don't really don't know, but my antennae is up realizing this isn't just a random rally in these normally boring and slow moving investments. I would blame it on a weaker dollar, but that argument has holes in it since the dollar is near a 6-month high right now.
OK, now that the paranoia is out of the way, we are faced with yet another potential "V" bottom. "V" bottoms seem to be more common these days than they were about 10 years ago where we saw more tests of the lows before a pullback was completed.
Some V bottoms are triggered by a change in monetary policy like after COVID when the world government threw money into the economy at a incredible rate, which of course led to a massive stock market rally, but it also led to high inflation, and subsequently a bear market for stocks.
Being that Friday's sell off was triggered by another tariff headline, removing that threat could lead to a reversal of the rally, but the stock market may have been in need of a rest, and that was a good excuse, so a run right back up to new highs may seem like the typical response to a rug pull, but the way stock charts work and the psychology involved with investors, the market may use the opportunity to take some time to wring out some excesses.
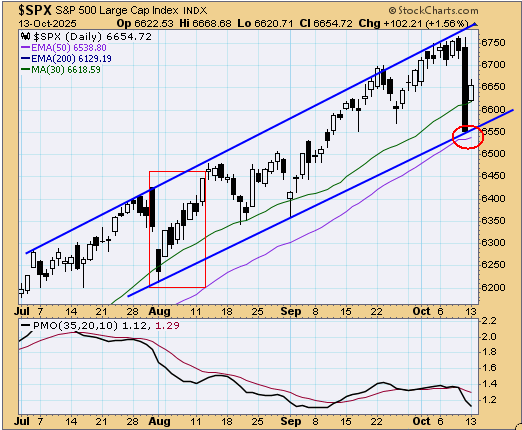
The S&P 500 (C-fund) had a big bounce back yesterday but Friday's decline was not normal. We did have a 2-day sell off a couple of months ago (red box below below) and stocks did just run right back up creating one of those V bottoms, and like I said, they've become more common. Years ago it was more typical to see the chart would chop around a while, perhaps retest that low - maybe make a new low or maybe come up just short, but the V was more rare.
These may be more dramatic, but years ago when we saw a nasty decline in a short amount of time, there was usually a test of that low, or at least an attempt to test those lows.
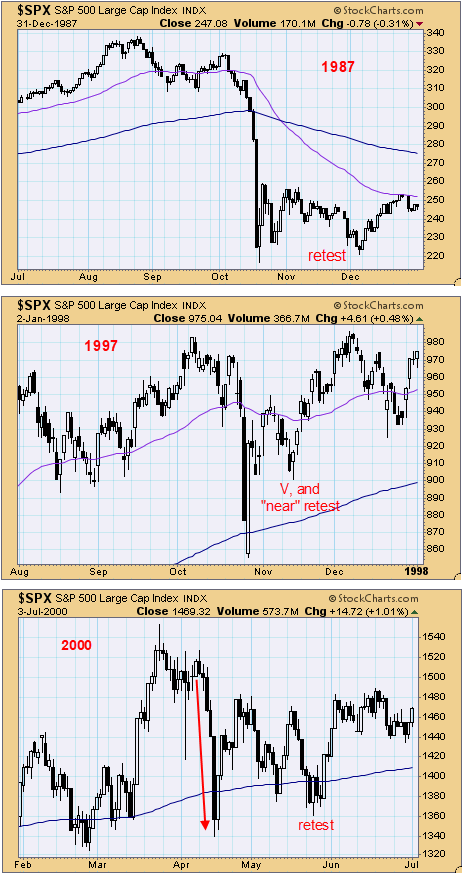
But again, V bottoms have become more common recently.
The Nasdaq 100 was up over 2% on Monday after Friday's disaster. The rising wedge on this chart broke down during that sell off and now it has risen back to the September peak and above that is the bottom of the wedge. Point being, in the past this type of break down would take a little time to repair itself with a potential for another test of Friday's low, and no guarantee that low would hold.
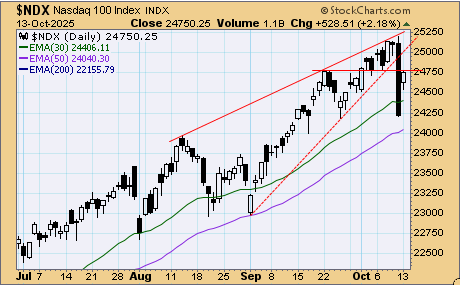
Nowadays, the market seems almost as likely to ignore the action on Friday and resume the upside. Only time will tell, but the lack of concern yesterday does get my attention that some investors need to get hurt again because they may be getting too bullish, too quickly, after a day like Friday.
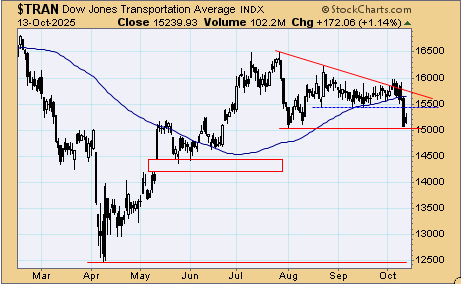
The Dow Transportation Index finally broke down on Friday after several weeks of moving sideways. It did hold on Friday at the August low, but there is that open gap down by 14,200, which could still be a target. This is considered a market leader but it really has been just floundering lately.
So, a V bottom has been more common in recent years, but historically they are not the stock market's typical response to a sharp sell off.
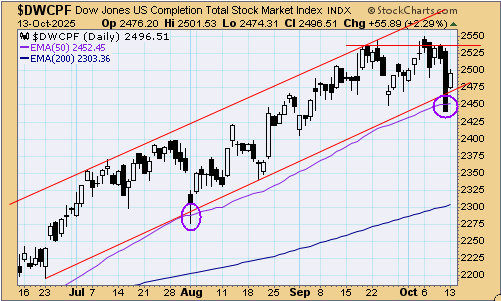
The DWCPF (S-fund) went from the top to the bottom of its trading channel quite quickly, but that flat top was a warning that something could be coming. However, things had been so bullish and we may have all been programmed to expect the most bullish outcome. The rebound on Monday was certainly impressive, especially closing near the highs of the day, but the chart could have some backing and filling to do, as I talked about above, with the possibility of a retest of the lows.
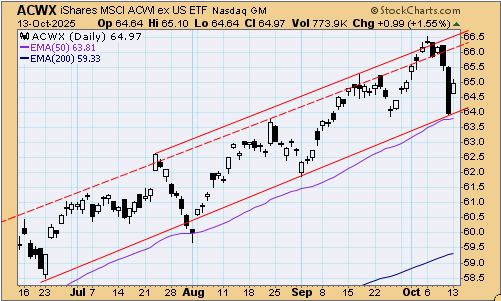
ACWX (I-fund) also bounced back nicely despite a 0.36% gain in the dollar yesterday, which could have easily given this fund some trouble. So far so good on these last two charts as the 50-day averages held on the initial test. The next few days will be very telling.
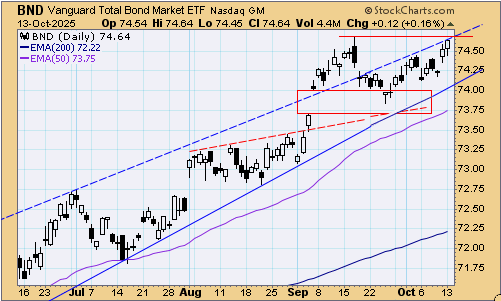
BND (bonds / F-fund) rallied for a second straight day as the run into the safety of bonds is typical during a steep stock market sell off. Now it is facing a double dose of resistance, so this will be a good test for bonds coming up.
Thanks so much for reading! We'll see you back here tomorrow.
Tom Crowley
Read more in today's TSP Talk Plus Report. We post more charts, indicators and analysis, plus discuss the allocations of the TSP and ETF Systems. For more information on how to gain access and a list of the benefits of being a subscriber, please go to: www.tsptalk.com/plus.php

Questions, comments, or issues with today's commentary? We can discuss it in the Forum.
Daily Market Commentary Archives
For more info our other premium services, please go here... www.tsptalk.com/premiums.php
To get weekly or daily notifications when we post new commentary, sign up HERE.
Posted daily at www.tsptalk.com/comments.php
The legal stuff: This information is for educational purposes only! This is not advice or a recommendation. We do not give investment advice. Do not act on this data. Do not buy, sell or trade the funds mentioned herein based on this information. We may trade these funds differently than discussed above. We may use additional methods and strategies to determine fund positions.
A lot has happened since my pre-holiday weekend commentary, and because of the holiday yesterday, the TSP fund returns do not reflect yesterday's rally, but rather Friday's bearish market action. The TSP will combine Monday's returns with Tuesday's when posted later tonight (Tuesday.) The index charts below are from Monday's price movement.

| Daily TSP Funds Return
More returns |
If you missed it, stocks were crushed on Friday after comments from President Trump regarding China's tariffs, but over the weekend it was played down some, causing stocks to bounce back yesterday. I don't think that battle is quite over yet so I expect volatility to continue for a little while longer.
Just looking at the gains in gold and silver recently, and yesterday alone where gold was up $125/ounce yesterday and silver pushed above $50 for the first time since 1980, I have been wondering what is going on. Why are investors, governments, and Central Banks racing into the safety plays of these precious metals?
I don't really don't know, but my antennae is up realizing this isn't just a random rally in these normally boring and slow moving investments. I would blame it on a weaker dollar, but that argument has holes in it since the dollar is near a 6-month high right now.
OK, now that the paranoia is out of the way, we are faced with yet another potential "V" bottom. "V" bottoms seem to be more common these days than they were about 10 years ago where we saw more tests of the lows before a pullback was completed.
Some V bottoms are triggered by a change in monetary policy like after COVID when the world government threw money into the economy at a incredible rate, which of course led to a massive stock market rally, but it also led to high inflation, and subsequently a bear market for stocks.
Being that Friday's sell off was triggered by another tariff headline, removing that threat could lead to a reversal of the rally, but the stock market may have been in need of a rest, and that was a good excuse, so a run right back up to new highs may seem like the typical response to a rug pull, but the way stock charts work and the psychology involved with investors, the market may use the opportunity to take some time to wring out some excesses.
The S&P 500 (C-fund) had a big bounce back yesterday but Friday's decline was not normal. We did have a 2-day sell off a couple of months ago (red box below below) and stocks did just run right back up creating one of those V bottoms, and like I said, they've become more common. Years ago it was more typical to see the chart would chop around a while, perhaps retest that low - maybe make a new low or maybe come up just short, but the V was more rare.

These may be more dramatic, but years ago when we saw a nasty decline in a short amount of time, there was usually a test of that low, or at least an attempt to test those lows.

But again, V bottoms have become more common recently.
The Nasdaq 100 was up over 2% on Monday after Friday's disaster. The rising wedge on this chart broke down during that sell off and now it has risen back to the September peak and above that is the bottom of the wedge. Point being, in the past this type of break down would take a little time to repair itself with a potential for another test of Friday's low, and no guarantee that low would hold.

Nowadays, the market seems almost as likely to ignore the action on Friday and resume the upside. Only time will tell, but the lack of concern yesterday does get my attention that some investors need to get hurt again because they may be getting too bullish, too quickly, after a day like Friday.
The Dow Transportation Index finally broke down on Friday after several weeks of moving sideways. It did hold on Friday at the August low, but there is that open gap down by 14,200, which could still be a target. This is considered a market leader but it really has been just floundering lately.

So, a V bottom has been more common in recent years, but historically they are not the stock market's typical response to a sharp sell off.
The DWCPF (S-fund) went from the top to the bottom of its trading channel quite quickly, but that flat top was a warning that something could be coming. However, things had been so bullish and we may have all been programmed to expect the most bullish outcome. The rebound on Monday was certainly impressive, especially closing near the highs of the day, but the chart could have some backing and filling to do, as I talked about above, with the possibility of a retest of the lows.

ACWX (I-fund) also bounced back nicely despite a 0.36% gain in the dollar yesterday, which could have easily given this fund some trouble. So far so good on these last two charts as the 50-day averages held on the initial test. The next few days will be very telling.

BND (bonds / F-fund) rallied for a second straight day as the run into the safety of bonds is typical during a steep stock market sell off. Now it is facing a double dose of resistance, so this will be a good test for bonds coming up.

Thanks so much for reading! We'll see you back here tomorrow.
Tom Crowley
Read more in today's TSP Talk Plus Report. We post more charts, indicators and analysis, plus discuss the allocations of the TSP and ETF Systems. For more information on how to gain access and a list of the benefits of being a subscriber, please go to: www.tsptalk.com/plus.php
Questions, comments, or issues with today's commentary? We can discuss it in the Forum.
Daily Market Commentary Archives
For more info our other premium services, please go here... www.tsptalk.com/premiums.php
To get weekly or daily notifications when we post new commentary, sign up HERE.
Posted daily at www.tsptalk.com/comments.php
The legal stuff: This information is for educational purposes only! This is not advice or a recommendation. We do not give investment advice. Do not act on this data. Do not buy, sell or trade the funds mentioned herein based on this information. We may trade these funds differently than discussed above. We may use additional methods and strategies to determine fund positions.
Last edited:
