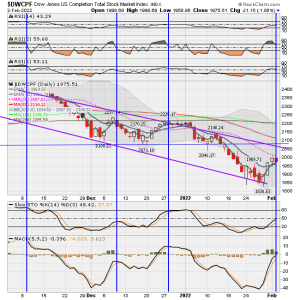
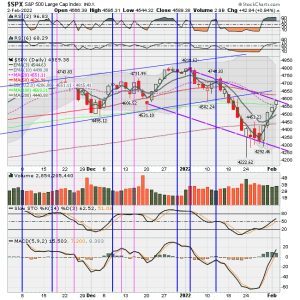
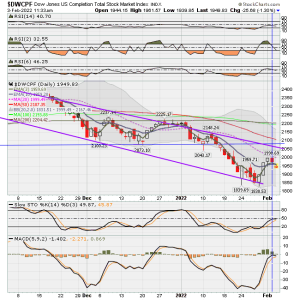
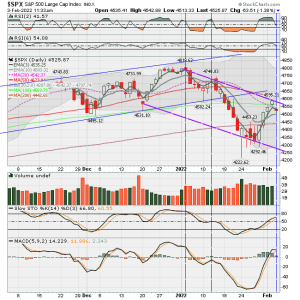
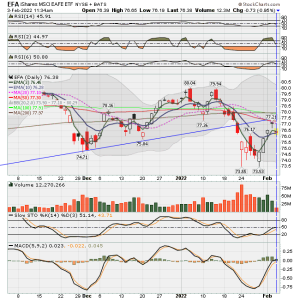
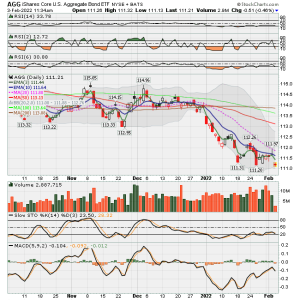
I was looking at several RSI indicators tonight, and decided I will begin using RSI-2 and RSI-6. Romulus at Groktrade uses RSI2 while Des at Groktrade uses RSI-6. I put them both on charts and visually compared them to price action, Stochastics and MACDs default plus MACD set at 5,9,2. I noticed that most of the time, when RSI-2 has reached 70 and beyond, chart prices tend to drop within a few days after the signal line crosses back down below 70. (See Blue Vertical lines) Seems to work best on S fund (DWCPF) charts but still good for spotting a drop just before it happens even on SPX C fund chart. NOTE: You may notice the vertical lines, in a few instances, are not precisely dissecting where RSI (2) signal black line begins to touch the 70 line. I repeatedly redrew line but upon saving it would move slightly, so seems Stockcharts program has a little issue with precision. In any case, adjust it with your eyes to look down at MACD and Stochastics and you will see how sometimes their lines are still rising while RSI(2) is already showing a drop.
So, I noticed that most of the time RSI(2) gives advanced warning and is quicker, typically by a day or two, than Slow Stochastic (14,3 setting) and both MACDs (default and the 5,9,2 fast setting) at tipping me off about a possible (and in my opinion likely) upcoming price drop! I am excited about this but only time will tell if this works reliably in future...but I think its promising. Of course, I will use it along with other analyses and tools.
These charts are hard to stare at with all the vertical lines, but I placed them in charts to study and compare actions on the different indicators and oscillators. As a result, I decided to drop the RSI 14,3 setting and MACD default, which both seem just too slow and not as good at acting as a leading indicator. So those indicators shown on the SPX chart are likely what I will now be using. However, I will leave Permachart links up (see post #4264 on page 356 ) for anyone to use. I may post permalinks for my new charts this weekend.
If you like, see if you can spot what I am mentioned in charts below. I did these analyses on about the last 8 months of price action on SPX and DWCPF but only showing three months here. I am satisfied that I can use RSI(2) plus RSI(6) from now on. RSI(6) seems useful to confirm some items.
So, if one chose to rely on RSI(2), it appears S fund would drop shortly (within a few days) as it has crossed below 70 on RSI(2) while C fund still has RSI(2)above 70, so no telling when it will cross down.
Okay don't have too much fun looking at these charts and promise to not blame me if you permanently become cross eyed!
