DreamboatAnnie's Account Talk

Hope it holds or takes off this afternoon for ya, make for a palatable exit.
I was think F fund entry today but decided against it.
 
I am not liking C fund and was in it 35%. I do like S fund and would like to add to my 10%S position, but then when it starts to drop, I would need to use my 2nd IFT of the month. So decided to just exit fully and wait for the next wave. Gosh one or two more IFTs per month would be so good. I hate TSP!
 
I should also mention that Fibonacci retracement indicated we are at about 50% retracement of the recent drop. I do believe I had looked at other recent drops and noted reversal seemed to occur at 50%. So, while there is no certainty on this, I thought about that plus broader market trend and that market recovered a lot in last two days...today is day 3. Also didn't like doji candle forming.
 
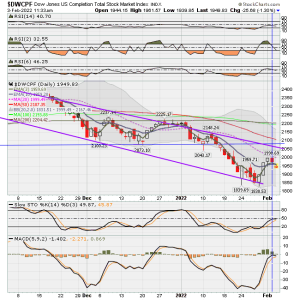
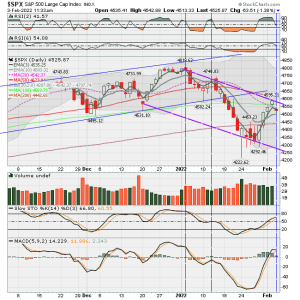
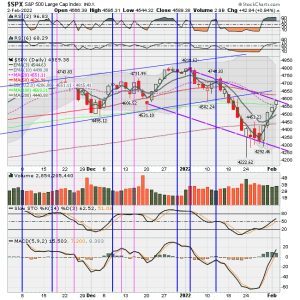
I was looking at several RSI indicators tonight, and decided I will begin using RSI-2 and RSI-6. Romulus at Groktrade uses RSI2 while Des at Groktrade uses RSI-6. I put them both on charts and visually compared them to price action, Stochastics and MACDs default plus MACD set at 5,9,2. I noticed that most of the time, when RSI-2 has reached 70 and beyond, chart prices tend to drop within a few days after the signal line crosses back down below 70. (See Blue Vertical lines) Seems to work best on S fund (DWCPF) charts but still good for spotting a drop just before it happens even on SPX C fund chart. NOTE: You may notice the vertical lines, in a few instances, are not precisely dissecting where RSI (2) signal black line begins to touch the 70 line. I repeatedly redrew line but upon saving it would move slightly, so seems Stockcharts program has a little issue with precision. In any case, adjust it with your eyes to look down at MACD and Stochastics and you will see how sometimes their lines are still rising while RSI(2) is already showing a drop.

So, I noticed that most of the time RSI(2) gives advanced warning and is quicker, typically by a day or two, than Slow Stochastic (14,3 setting) and both MACDs (default and the 5,9,2 fast setting) at tipping me off about a possible (and in my opinion likely) upcoming price drop! I am excited about this but only time will tell if this works reliably in future...but I think its promising. Of course, I will use it along with other analyses and tools.

These charts are hard to stare at with all the vertical lines, but I placed them in charts to study and compare actions on the different indicators and oscillators. As a result, I decided to drop the RSI 14,3 setting and MACD default, which both seem just too slow and not as good at acting as a leading indicator. So those indicators shown on the SPX chart are likely what I will now be using. However, I will leave Permachart links up (see post #4264 on page 356 ) for anyone to use. I may post permalinks for my new charts this weekend.

If you like, see if you can spot what I am mentioned in charts below. I did these analyses on about the last 8 months of price action on SPX and DWCPF but only showing three months here. I am satisfied that I can use RSI(2) plus RSI(6) from now on. RSI(6) seems useful to confirm some items.

So, if one chose to rely on RSI(2), it appears S fund would drop shortly (within a few days) as it has crossed below 70 on RSI(2) while C fund still has RSI(2)above 70, so no telling when it will cross down.

Okay don't have too much fun looking at these charts and promise to not blame me if you permanently become cross eyed!
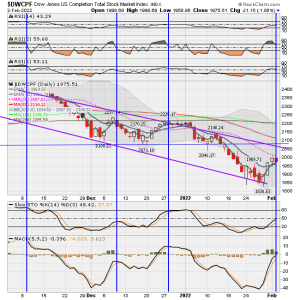
S FUND - DWCPF DAILY.png


C FUND - SPX DAILY.png
 
Last edited:
Pink vertical lines are where signal line just barely got to 70 and backed off in RSI(2). Also, when I posted above, I was still deciding if RSI(6) is useful enough to keep on my charts. Right now, I see no additional benefit so looks like I will drop it and just keep RSI(2).....hummm...but I might keep it for a couple weeks. RSI (14) will definitely be removed unless I can figure out why to keep it.

If anyone would like to comment on anything, please do!

I will remove all vertical lines before posting tomorrow and will only include the most recent vertical line when /if a signal line crosses below 70, as it did on DWCPF today.

Also, just noticed the SPX price got up to the upper short term trend line (purple dashed), so it will be interesting to see whether prices pops through it tomorrow.

Best wishes to you all! :D

P.S. It's getting cold here in Texas. Everyone freaking about the hard freeze, sleet and possible snow we are getting for next couple days. We all remember last year! Hope the grid holds up! I have tons of food, water, toilet paper (lol), firewood, torch, camp stove and plenty of propane! :smile:
 
Last edited:
Looks good. 30 below 0 this AM in northern Minnesota, will get up to -4 today with sunny skies at least. Loaded up the wood stove with nice dry Oak.
 
I couldn't put together a chart to save my butt, cause if I did, they'd look like the ones below.
Keep doing what your doing. We'll figure it out or ask you questions if we cant.
And to everyone who takes the time to put stuff like this together and use visuals in their posts, thank you very, very much!!!
It's great info and it's nice to have something to look at.
THIS is what my charts would look like if I did some:

CaptureL.PNG CaptureLL.PNG

...
 
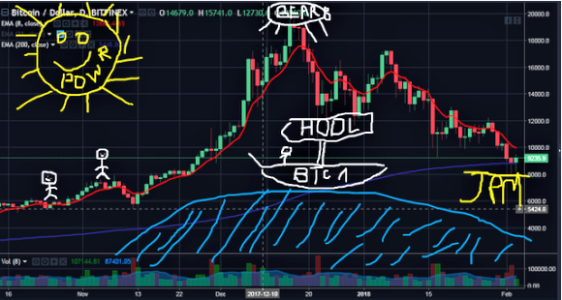
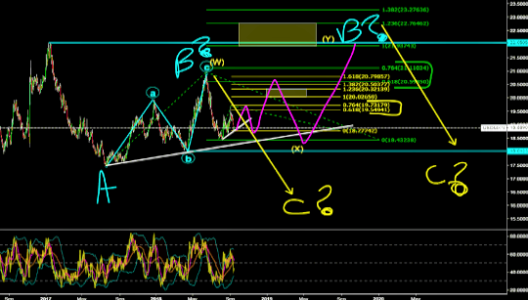
You know Epic...I really love your charts! :D ... Love the smiling sun, stick men, stick bear--lol :laugh:. I must learn how to draw like that. I do share in question marks as I do not get the Elliot Wave (???) A-B-Cs!

PLUS..your charts don't give me a headache! When I look at mine, I must have music playing in background to calm my inner savage beast! Lol..:rolleyes:

PS I tried to give you rep points for those charts but alas I must spread some around! :grumble:
 
Last edited:
Here are charts as of a few mins ago.

SPX -C Fund - Looks like short term (purple dashed line) resistance line is holding so far today, and RSI -2 has now dropped below 70.
Also, now see that Stockcharts automatically adjusts my vertical line placement to display down the middle of the candle. So that explains my issue noted for analyses discussed on post 4286.

Best wishes to you all!

S FUND - DWCPF DAILY.png


C FUND - SPX DAILY.png


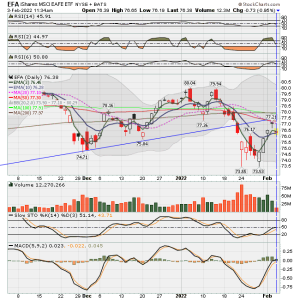
I FUND - EFA DAILY.png


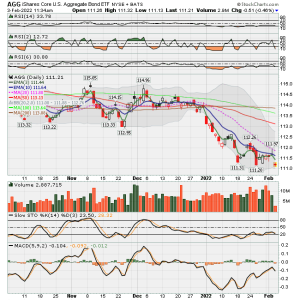
F FUND - AGG DAILY.png
 
I gave him some points for you. :smile:

Your Awesome Bquat! :smile: Thank you...now that's what I call team work!!! :banana:

P.S.I tried giving you some reputation points a couple weeks ago but needed to spread more out. I just tried and it worked! Thank you for your Teamwork plus your consistent and great charts!
 
What do you use for taking/placing buy or sell signals? Nearly impossible to do in real-time in TSP, but I'm currently doing a test now...... Probably a waste of time with only two moves a month with the type of trading system I use, but I'm still going to give it a shot. Anyway, that is why I was asking. I'm always looking for another tool to add to my tool box..... We shall see if the current low gives us a trend to trade. My son is a GS-13 and asked me to see what I could come up with. LOL..... I told him to move his money to Vanguard, but of course he can't.....

Take Care.....

Thanks.
 
For entry, I favor waiting for Slow or Full Stochastics to drop below 20 and then begin to rise before entry, plus look at candle formation to try to see a bottom. But entry also depends on whether price is above the mid-point (same as 20 SMA) of Bollinger band. Because entry while below mid-point is higher risk and I need to continually remind myself to treat those situations as if we are in Bear market.

I consider lots of other factors but those are usually my main "must" factors for entry. However, if price does not rise enough within 3 days so that MACD default crosses its signal line upward, or price doesn't cause Stochastic to get to 80, I consider it a "weak" wave up and must consider exit as soon as the Stochastic touches the 80 line. That is why seeing the RSI-2 correlation with price drops has me a bit excited. It seems promising to maybe place some reliance on this factor to pick an exit point. But in all cases, I try to never place reliance on just one indicator.

I also started to study the 3 EMA as a line in sand to decide on exit. I saw many of your awesome "Robo" postings and that indicator is very good! I like that price dropping below it really gives a sense of market starting to teeter. Of course, there are always outliers, but this is a very good indicator and it is now in my toolbox and now on my daily charts.

Right now, because price is below BB mid-point and we are in an overall market downtrend, I made effort to sell the rally before it ended, even if it meant losing some upward price action. I also looked at short term trendlines and tried to apply some Fibonacci retracement. Goal was just to get some of losses back and chip away at it. Plus, it's just hard with only two IFTs per month as it means we only really have one transaction per month (entry &exit).

I really screwed up in January because I did NOT follow my entry strategy as price had not dropped below Stochastic 20 (i.e. It did not hit that mark until 1/25,1/26,1/27), and then after bad entry, I failed to quickly execute the exit strategy when the uptrend failed almost immediately upon entry 1/11 & after reallocation on 1/12. I just couldn't stand the thought of exiting only to then see it reverse back up and to be out the rest of the month. Mea culpa! :( So, I believe my strategy is good but I have not been disciplined enough to execute properly and to have faith in my decisions. I am working on it.
 
Last edited:
You may want to view post 4285 charts. The RSI-2 was showing the downturn on DWCPF chart to provide a clue for possible exit opportunity on Wednesday. There was no other clue to my knowledge. Except that I did notice volume was decreasing at end of January while price was jumping...on VXF and SPY. I had read a book that mentioned that this indicates divergence between volume and price indicating possible trend change. This is so hard to spot but volume was significantly lower while price was blasting off. Will need to cite the book. I believe it was written by co-founder of Investor's Business Daily ...old book.
 
Last edited:
Downturns are very stressful. I was so relieved to finally exit. I feel for you KB. :(
You may want to consider where your stop point is before hole gets too deep. I only say that because it may continue stair stepping down, so selling during short rallies might be helpful.

Best wishes to you and Everyone!
 
Back
Top