DreamboatAnnie's Account Talk

Good morning! Has anyone noticed not being able to Like posts??? :worried:

Hum.... well... I DID IT!! :laugh: I am now 100%G. I hope the nice start up this morning stays that way throughout the day and continues going up. I will likely end with loss on this last buy in. I entered market with 60% on 9/9 and then increased to 100% 9/19 in attempt to cut loss (thinking it might go up again!)---primarily in S fund with a little in C and I. But oh well.... will live to fight another day... dang it!

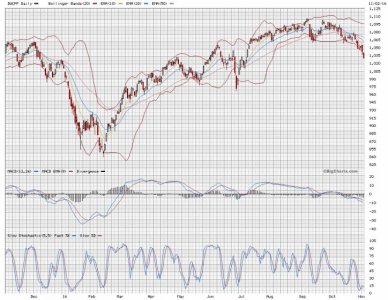
I am thinking this is a nice little dead cat bounce, and I think there might be a few more up and downs like that, but with the crossover of 20 day EMA below 50 day EMA on the C fund (SPX) chart and with the two other's 20 EMA lines closing on the 50, and just historically looking at this cross over and what happens afterward, I am fairly certain this continues down over the next couple months. Of course, no one can know for sure what will happen in the future, but I am comfortable with this decision to exit---even with a little loss. I still have another IFT left this month to re-enter... maybe at a bottom and probably at a lower point---for ONLY a day or two (very short in and outs from this point on for awhile). Will see....

Hope you are having a GREAT Day and Have a nice weekend! Best Wishes on your Investments!!!!!!! :smile:
 
The Good Evening,
Here are some charts. These are Weekly charts which I have set to 2 week, 4, week and 10 week Exponential Moving Averages. Looks at 2 years (104 weeks). I am mainly looking at the market trends that occur after BOTH the 2 and 4 week EMA lines cross below the 10 week EMA line.

S Fund - DWCPF - Notice that when the 2 and 4 week EMAs both crossed below the 10 week EMA during the past two years, in late June 2015, this was followed by a 7 month overall downturn (until Jan/Feb 2016). If looking 3-4 years back, it happened a few times but only resulted in a few weeks to month of volatility and whipsaws. This 2-4 over 10 week crossover just occurred last week.

Dow Jones U.S. Completion Total Stock Market Index, XX:DWCPF Advanced Chart - (DJW) XX:DWCPF, Dow Jones U.S. Completion Total Stock Market Index Stock Price - BigCharts.com


C Fund - SPX - The cross over does not result in much of a drop on this chart, even going back 3-4 Years, except when the crossover occurs in conjunction with tightened/contracted Bollinger Bands.

S&P 500 Index, SPX Advanced Chart - (SNC) SPX, S&P 500 Index Stock Price - BigCharts.com


I Fund - EFA


Hope you have a good evening and Best Wishes on your Investments!!!!!!!!
 
Last edited:
Also, I have been looking at Chris Ciovacco videos that Nnuut posts. This week's video includes information on use of 30, 50, and 200 week moving averages for a longer term view and his analysis indicates we are still attempting to stay on market uptrend. Encouraging in the long term!!! :smile: He also points out regular noise and volatilty that does involve counter/down trends that can involve small decreases (i,e. 4,5,6 %). So its should be reassuring if you are a very long term investors, which he indicated that 50% drops, like what occurred in early 2000s and in 2008, are less likely at this time based on current indicators. . Humm......only problem is I am very short term investor. But still, it is reassuring! :smile:
 
Well.. I continue to view Chris Ciovacco videos tht Nnuut posts. This week, he emphasizes importance of the 200 day EMA/SMA. He indicates that when this line is up provides a good basis for a longer term outlook. Right now it is gently sloping upward, as opposed to the downward slope it has taken on in prior years where "bad things" happened... although weeks later.

That said, I did notice that RSI is crossing about the 50 line on that chart. Looking at prior periods, when we've been below that line and cross above the 50 RSI, "good" things tend to happen. But more importantly, I was looking at the MACD on SPX and it just crossed positive after last week's rise in Slow Stochastic. That is typically one of my "go in" indicators when SS goes up from around 20 or so and then MACD follows to cross positive. DWCPF (S Fund) is not there yet but looks like it might follow the C fund. So I am going to buy in today.... wish me luck!!

Just not decided on how much... Right now I am thinking maybe 35C/35S but might go in at 50/50. Humm....

Best wishes to you on your investments!!!!!!!!! :smile:
 
owwweeeee.... but looking at intraday it does look like mayyyyybee just a little whipsaw!! Hoping it reverses and goes up... if not stick a fork in me and I am done!!! :rolleyes:

Yep.. went in yesterday 50/50.

Hope you are all having a great day! Best Wishes on your Investments!!!!!!!!! :smile:
 
Good morning, Some charts!! I'm done and exiting. Dont like look of charts and believe it continues down. Will take my loss and wait for better chart with 20 above 50 and with 200 at least sloping up.

Best wishes to you on your investments!!!!!! :smile:

C Fund -Daily - 20, 50, 200 EMA -200 starting to go sideways. 20 below 50

S&P 500 Index, SPX Advanced Chart - (SNC) SPX, S&P 500 Index Stock Price - BigCharts.com

S Fund

Dow Jones U.S. Completion Total Stock Market Index, XX:DWCPF Advanced Chart - (DJW) XX:DWCPF, Dow Jones U.S. Completion Total Stock Market Index Stock Price - BigCharts.com

WEEKLY charts....i like these best for better Longer Term overall view

C Fund- 3 Years - 4, 8, 12 week EMAs
S&P 500 Index, SPX Advanced Chart - (SNC) SPX, S&P 500 Index Stock Price - BigCharts.com

S Fund - weekly - 3 years
Dow Jones U.S. Completion Total Stock Market Index, XX:DWCPF Advanced Chart - (DJW) XX:DWCPF, Dow Jones U.S. Completion Total Stock Market Index Stock Price - BigCharts.com
 
Last edited:
Well...listening to latest Ciovacco video. He seems confident of market going up. Hummm...
Good evening and Best Wishes on your investments!!!!!!! :smile:
 
Good evening,

Well I tried posting charts earlier but then decided to refer to links at my post#1707. However, those links are not working. i think the firewall upgrade is blocking access to the BigCharts website. So I made images to input. Sorry but these can only be viewed by logging in. These charts are daily 1-year charts that show the 10, 20, and 50 Exponential Moving Averages. On both charts, the 20 EMA crossed below 50 EMA a couple weeks back. That is a Major crossover that usually results in large market drops before recovery. Still looks like this could drop more. How much is the big question. But maybe by looking back at past 20/50 Crossovers to get an idea.

C Fund -SPX - Daily
image.jpg

S Fund -DWCPF - Daily
image.jpg
 

Attachments

  • image.jpg
    image.jpg
    99.8 KB · Views: 174
Here are some charts for 2015 showing the 20/50 EMA crossovers.

On the SPX, there was one crossover in late June, but then it kept crossing back and forth like a twisty cinnamon stick until it finally took large drop in August. Then you see another 20/50 crossover in mid December, and we all remember how that turned out. Caution!!!

C Fund -SPX in 2015
image.jpg


In the S Fund, it crosses once in mid-july and withina month, the market tumbles. Then we see crossover in November followed by a quick Dead Cat Bounce followed by another crossover in December before the large drops in January. Are the drops we are seeing now just the beginning??? No one knows for sure. Just something to think about for those still in market. Unfortunately, no crystal ball here.

Best wishes to everyone on your Investments!!!!!!!! :smile:

S Fund -DWCPF in 2015
image.jpg
 
Last edited:
Well... decided to take the plunge. Cross overs look good 20 going over 50 EMA. So will jump in. I know a pull back is coming, but at this point, looking to stay in longer. Will see how that goes... Going in 50C/30S leaving 20G in safety.

Hope you are all having a Great Day and Best Wishes to you on your Investments!!!!!!! :smile:
 
Hi ! Wow... don't know what happened but I did not have access all day today. Just now got access. I tried from my ipad and Surface Pro. Had a weird Securi firewall.
proxy error message. Thinking Tom got message I was able to send from mobile phone. I have access now. This happened earlier in the week too, but I know there has been some work on the server. So I guess all is fixed now.

It's been a great weekend to just look at charts and decide how to proceed. I am thinking longer term at this point. Will see how long that lasts...
Oh and best wishes to you too WhipSaw!! Friday was a bit down, but hoping that doesn't continue on. In either case, setting up a stop... just haven't decided what point that is... I want to use a longer term strategy from now on.. Working on it!

Hope you all have a Good Evening and Best wishes to everyone on your Investments!!!!!! :smile:
 
I looked at charts and wow... What a beautiful rising wedge. No telling how long it will last, but I'm sticking in until I see some breakdown. Trying to stay in market longer. Still haven't revised and set longer strategy, but going by the one I do have, I plan to stick in until I see intraday prices on a daily chart touch the 20 day EMA.

C Fund -SPX
S&P 500 Index, SPX Advanced Chart - (SNC) SPX, S&P 500 Index Stock Price - BigCharts.com

S Fund -DWCPF
Dow Jones U.S. Completion Total Stock Market Index, XX:DWCPF Advanced Chart - (DJW) XX:DWCPF, Dow Jones U.S. Completion Total Stock Market Index Stock Price - BigCharts.com

It's a monster rally but things can change quickly. The Chris Ciovacco video that Nnuut posted this week is good. I am remembering that several weeks ago Ciovacco was pointing out that lots of technical charts were indicating the "probability" of good things happening. He always emphasizes need to keep an open mind either way...up or down. I looked into his seevices sometime back...only handles portfolios of $500+K. In any case, i like to listen to the videos that come out each Friday.

Wishing you all a great weekend and Best Wishes on Your Investments!!!!!! :smile:
 
Last edited:
It's a nice start to the weekend. Yesterday was a beautiful day spent with family. I made the whole big meal with Turkey, cornbread stuffing, fresh cranberry, sweet raisin-ham-bacon-bread dressing that my grandma used to make, buttery mashed potatoes, green bean casserole, sweet yams with pecans and marshmellows, rolls. Also made cherry and pumpkin pie with homemade pie crust. The slightly sweet crust came out flaky crispy but not burnt! :D Thats the hardest part of the whole meal.... Hoooray!

So today went to see Doctor Strange (Benedict Cumberbatch). 3-D, in a theatre with recliner...comfy! Movie was really good...loved the special effects and story line was good too. Dont know why I am so chatty tonight, but guess things are just riding smooth right now ans Im enjoying it! :smile:

So I'll end with nice relaxing song, by Taeyeon. Song is called "Rain" and its about longing for a past love.
 
Good morning.... So I'm undecided on an exit today. I want to exit because I know seasonal lows tend to hit around day 4 and into the middle of December before the Santa Rally hits. But, my indicators are not saying to exit yet. So what do I follow???

Right now the DWCPF (S Fund) daily chart has price in a rising wedge; albeit it is starting to meander sideways and looking to consolidate. But, the trigger to exit has not yet occurred. Waiting for a candlestick wick to touch the 20 EMA and it hasn't even touched the 10 day. Also, even though MACD is starting to move downward from its lofty high and the embedded reading in Slow Stochastic is now moving below 40, I have often seen the market continue to meander up for time before plummeting. Ditto for SPX = C Fund.

Then again, the rise was spectacular since Trump became Pres-Elect so that could be the reason why (mathematically harder to touch 20 EMA with such a quick high rise). There are other things to consider too---OPEC meets tomorrow right?? Then we have jobs reports on Friday and I understand talking heads say number could be huge... above 225k. Even heard one guy talking about the unexpected could be a .5% increase in Funds rate instead of .25%... hummm... that would maybe freak the market out for a few days, but otherwise think the rate hike is baked in although reality tends to finally hit home. So still expect some effect.

Well have 18 minutes to decide. I am thinking to stick with my strategy at this point. Hoping I am not sorry later. So for now I am sticking in another day. Gosh.... hate to waste an IFT, but I would cry if it continues to float up and I went against my strategy by exiting (once again!).... so I'm sticking. See ... I thought it through and convinced myself... lol... :laugh:

Wishing you a Great Day and Best wishes on your Investments!!!!!!!!!! :smile:

P.S. I think it is time for a little April Wine! Sign of the Gypsy Queen...

 
Last edited:
Thanks DBA, was wondering where you'd been... will be throwing my other 50% in today, all in for December! :D
But there will likely be some downside WS! Next week and probably until mid month. But we shall see.
I am now in so, all I can do is exit once my indicator hits and then have one chance to get in on any Santa Rally. Wheww..... will see.
 
Back
Top