DreamboatAnnie's Account Talk

Best of luck with the markets Annie and congrats on TSP Poker! Nice job there!!

With respect to the markets, one of the questions is what happens to oil. If it continues to tank I think things go south. Also there is another Full Moon this Saturday I believe. Basically, stock prices tend to be higher around the time of the New Moon each month and reach a temporary low point around the time of the Full Moon; at least that's the theory. Also I think Yellen and Fischer speak this week which tends to be hawkish for the dollar. Final thing on the radar is anything doing with the election. The markets will be skittish regarding any rumors, etc. But the Wall of Worry can be profitable to those willing to deal with all that anxiety. For me, it's about capital preservation and see what happens in October.

I'm still thinking 2200 in the near future but can't read the tea leaves to see if it is this week or in October. Look at Bquat's chart...things are coming to a head but which way it breaks is up in the air.

Final thought for the bullish....last week of the month heading into Q4 would seem to be a good time for markets to rally...just to add a contrarian view to counter the above jibber jabber..

FS
 
Last edited:
Hi FS, Thanks! I also have been thinkng and hearing about oil. Sounds like it could be going down...need to stay tuned to OPEC meeting. Thought some talk today, but more tomorrow....check out article. Indications it could go to $40. More meeting tomorrow. Uggh...
http://www.cnbc.com/opec/


Now heres a little song... Reminds me of fun times in life!

 
Hummm... Per more news. They dont expect deal tomorrow on oil but better chance at more formal meeting on Nov 30. But in the interim oil may slip to $43.

Best wishes to everyone on your Investments!!!!!!! :smile:
 
Good Evening! So OPEC made a deal to cap oil production. That was unexpected! So now, that is one thing that might sit on back burner for awhile. I should think this frees market to continue upward....well, if it were not for the election.

Wondering if Thursday is a good day to exit, or stay in until end of next week. Seems like Fridays have been the profit taking day as of late, and equities drop. Decisions ...decisions. Charts unchanged to very slightly improved.....heck its just a no mans land!

Well my hunch is that markets continues up slowly with possible drop on Friday. Whens the next debate???? I think i want to be out next week at the latest. Not sure i want to handle the volatility that will surely start to increase as we get closer to election day. I just really dont want to exit too early. MACD is still slightly above its signal line...if it dips below I guess I will exit. Will see....

Best Wishes to all of you on your Investments!!!!!!! :smile:

P.S. So while I want to exit tomorrow, i'll probably stay in another week....but I really want to bolt! :sick: Will see....so as I see it, its a decision to exit tomorrow or wait another full week. It did seem like some folks entered market earlier in week....people have some hope!
 
Ugghh... I am staying in! one more week... I seriously dislike the market... but I stay one more week. :sick:
I noticed more people moving in.... scary!!!! Takes guts to do that...... :worried: But it could be going up.... to me it looks like S fund is set up to do that. Slow Stochastic starting to cross positive although it did not dip much below 60. Really like to see it go to 20 and start going up before an entry. What can I say.... I am already in 100%!! Last time it did that (hit SS 20) was about 9 days ago and then had a nice but short 5 day run up. Not sure if I can count that as the same run as this one...so my point is that seems this one will be a weak run up... but we shall see.... Humm..

Best Wishes to you all on your Investments!!!!!!!!! :smile:
 
Hummm... This is all I see. Appears a few Fed Governors have been talking today and Janet is going to speak today at 4pm. Also, per this article, folks are rethinking the OPEC deal from yesterday. Then of course the banking issue in Europe. I didn't see much else out there to explain the noon drop.

Dow drops 170 points as focus shifts to Deutsche Bank, Fed - MarketWatch

Best Wishes Everyone and Hope You are Having a Beautiful Day!!!!!! :smile:
 
Europe’s DAX, SMI & BEL20 market indexes all took a dive at close of business, which is about 11:30 EST, probably all related to Deutsche Bank.
 
Hello!! So here are some longer term charts I was looking at tonight. These are set to look at weekly...2, 4 and 10week EMAs, plus the Slow Stochastic, MACD and Bollinger Bands (default). .....followed by a Daily set to 10.20.50 EMAs.


The weekly chart (look at 1 year) now shows MACD touching and looks like it will move below its signal line. But Slow Stochastic looks to be rising....hummm. I want to exit ...no crystal ball, but I prefer to be out with MACD dropping...I know it could keep meandering for a time and still have price go up. But I guess I keep thinking a really big drop has not yet occurred... so I'm just waiting fr te shoe to drop!!!. I guess will exit Tuesday or Wednesday... or Thursday at latest Right now, futures are slightly positive. Will see....

Hope you are having a good evening.... and Best Wishes on Your Investments!!!!!!!!! :smile:

WEEKLY - DWCPF - 5-years -Big picture view (price has not yet broke through highs of 2015), but 10week EMA is still sloped up.

Dow Jones U.S. Completion Total Stock Market Index, XX:DWCPF Advanced Chart - (DJW) XX:DWCPF, Dow Jones U.S. Completion Total Stock Market Index Stock Price - BigCharts.com

WEEKLY - DWCPF - 1year....for closer look at EMAs
Dow Jones U.S. Completion Total Stock Market Index, XX:DWCPF Advanced Chart - (DJW) XX:DWCPF, Dow Jones U.S. Completion Total Stock Market Index Stock Price - BigCharts.com

DAILY -DWCPF - 6 MONTHS ...EMAs still sloped up.

Dow Jones U.S. Completion Total Stock Market Index, XX:DWCPF Advanced Chart - (DJW) XX:DWCPF, Dow Jones U.S. Completion Total Stock Market Index Stock Price - BigCharts.com
 
Last edited:
More importantly, on weekly chart, MACD crossing down/closing to begin going below its signal line. I will wait one more day, to exit, but definitely exiting this week unless things change drastically to the positive side. The daily shows a little promise.... Will see!!

Wishing you a Happy Day and Best Wishes to you on your Investments!!!!!!!!!!! :smile:
 
Just an observation. It seems that MACD is much more correlated to prices on the Weekly chart. On the Daily chart there are many times when MACD is dropping for a time and yet price continues to rise...Ex. August 2016.

Here is the Weekly for a 2 year period. I see MACD tracks prices and so when MACD crosses below its signal line that usually is also when a drop (of more than just a few weeks) occurs.

WEEKLY - 2 YR - DWCPF (S FUND) Weekly EMAs set to 1,20,50 week. The 50-day EMA "SLOPE" is a very nice longer-term indicator.

Dow Jones U.S. Completion Total Stock Market Index, XX:DWCPF Advanced Chart - (DJW) XX:DWCPF, Dow Jones U.S. Completion Total Stock Market Index Stock Price - BigCharts.com

Here is the Daily for a 1 year period. See how MACD does not always follow what is happening on a daily basis. I am sure someone can explain the reasoning as being part of how MACD averages prices for 26 days, etc. But at this point, I just am trying to see how I can better use it as part of an overall strategy for getting in and out.

DAILY - DWPCF (S Fund) - EMAs set to 10,20,50 day.
Dow Jones U.S. Completion Total Stock Market Index, XX:DWCPF Advanced Chart - (DJW) XX:DWCPF, Dow Jones U.S. Completion Total Stock Market Index Stock Price - BigCharts.com

BOTTOM LINE: Still in equities, but definitely creeping closer to the door. Tomorrow???? :rolleyes:

Best Wishes to Everyone on Your Investments!!!!!!!!! :smile:
 
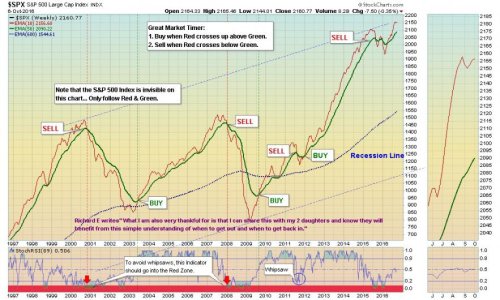
I really like this long-long term strategy! Above the Green Line (free public charts out on Stock charts.com) notice its basically an and out based on WEEKLY 20 and 50 EMA crossovers. I would like to find a strategy that is a cross between my current strategy and this longer term strategy.

Above the Green Line - Oct 6, 2016 Buy high, and Sell Higher: Momentum Investing - Joanne Klein - Public ChartList - StockCharts.com

image.jpg

Hope Your Having A Great Evening, and Best Wishes to You On Your Investments!!!!!!!! :smile:
 
Good Evening,
Here are some charts set to show 20, 50, and 100 daily Exponential Moving Averages. I'm using these settings to keep an eye on possible crossover of 20 below the 50. C fund is about to cross below the 50 EMA. The S fund and I Funds are not there yet but slope of 20 and 50 EMAs are starting to slope down. The Fund crossed negative Back around Sept 12-14, reversed and moved up to have 20 kiss the 50 and dropped back below the first week in October.

So what does all this mean? Be afraid! Be very afraid! Lol... Okay just joking. :D. I wish I had a crystal ball.... I guess I am thinking that S fund will follow C fund's lead and drop too. I think more pain's coming and I keep asking myself, Why the Heck Am I in the market??? Reason: Trying to not lose on this buy. Will see how it goes tomorrow. If it looks half okay .....like its not dropping like a rock tomorrow, I want to exit. Wanted to do that last week. I really dont want to wait much longer because I am afraid everyone else will get the same sane idea and then we will be stampeding to the exit as I lose all my clothes as I scream running to the exit...only to find it locked. Just really dislike those end of day massive drops. Gish...yesterday was awful!! Then of course, I'll exit and the market will skyrocket and I will cry like a baby!!! :bigeyes2:

Best Wishes to You all on Your Investments!!!!!!!! :smile:

C Fund - SPX
S&P 500 Index, SPX Advanced Chart - (SNC) SPX, S&P 500 Index Stock Price - BigCharts.com

S Fund - DWCPF
Dow Jones U.S. Completion Total Stock Market Index, XX:DWCPF Advanced Chart - (DJW) XX:DWCPF, Dow Jones U.S. Completion Total Stock Market Index Stock Price - BigCharts.com

I Fund - EFA
iShares MSCI EAFE ETF, EFA Advanced Chart - (NAR) EFA, iShares MSCI EAFE ETF Stock Price - BigCharts.com

F Fund - AGG
iShares Core U.S. Aggregate Bond ETF, AGG Advanced Chart - (NAR) AGG, iShares Core U.S. Aggregate Bond ETF Stock Price - BigCharts.com
 
Last edited:
Futures are down, big trouble in little china it seems. That's a fairly nightmarish scene DBA, running for the exit to find it locked and all; you're channeling Poe or even Stephen King. I'm on the other side of that door, I think. I need a good entry point; if Tom is right and we're entering a declining market, short term plays will be the order of the day.
 
I think Tom is right... short term plays. Too late to exit now... was busy at work. Taking lunch break now. Dang...This is awful!
Will look at charts again and see what looks best as far as next action.

I may have no choice but to stay in until market recovers. I hope this is not 2008 all over again. I will have to set a stop at this point. How much pain can I endure??

Take care and best wishes to you and everyone!!!!! :smile:
 
Lol..... :laugh: yes I am but... Market was awful at start! Glad it recovered some... I looked at charts again per links on earlier post...they update automatically. Yep... The 20 EMA crossed below the 50'EMA for SPX. Clicking on timeframe at left of chart, i expanded to look at 2 years ..just to look at that cross over in past. When weve been in an uptrend, like first half of this year, and then that crossover occurs....its bad news!! Saw that happen in late Summer 2015. Sometimes market drops quick and other times it can give a dead cat bounce or two, but I think it is going down much more. I am out!! First thing in the morning before I start work day, i am getting out!! Im pretty much down to my skivies! :embarrest: I'm screaming uncle! Keep that door open!!! :D

Gosh..hope there is not a stampede tomorrow...then again i thought I heard Yellin may talk Friday!:sick:

Hope you all have a great day and Best Wishes on Your Investments!!!!!!! :smile:
 
Last edited:
Back
Top