DreamboatAnnie's Account Talk

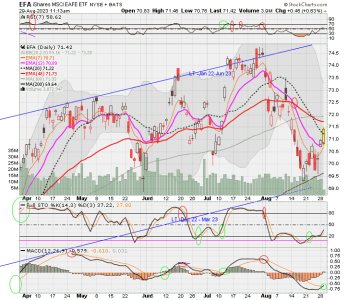
Charts before cutoff :smile: Note.. I have no IFTs, so I could not get in even if I wanted to. In any case, it's looking like a nice bounce. But MACD not yet crossed above its signal line though it looks to be headed that way. I am watched the whipsaw zone line (red dashed just under 50 in Stochastic). But RSI and Stochastic looking great!

01 - S FUND - DWCPF DAILY.png

02 - C FUND - SPX DAILY.png

03 - I FUND -EFA DAILY.png

04 - F FUND - AGG DAILY.png
 
Hi, here are charts before cutoff. MACD now going positive (crossing above its signal line) for C Fund & I fund. :banana: So, per my strategy that's a buy signal... F fund crossed up a few days ago. F and C are above whipsaw zone. S Fund getting close. But no IFT... Dang :(

01 - S FUND - DWCPF DAILY.png

02 - C FUND - SPX DAILY.png

04 - F FUND - AGG DAILY.png
 

Attachments

  • 03 - I FUND -EFA DAILY.png
    03 - I FUND -EFA DAILY.png
    42.8 KB · Views: 216
I picked up Buffalo Springfield's first album the other day - they launched with a double album! I'd never seen that before... good stuff too. :D
 
Charts before cutoff... Hard to not get into S Fund at this point with 13EMA crossing above 48.5EMA, but the MACD cross over happened more than 4_5 days ago so I really dislike a chase. Last half of September us seasonally weak. I want to have an IFT to enter when next signal hits...darn, I guess I will stay on sidelines. That's hard to do.

01 - S FUND - DWCPF DAILY.png

02 - C FUND - SPX DAILY.png

03 - I FUND -EFA DAILY.png

04 - F FUND - AGG DAILY.png
 
Charts before cutoff. Looks like S and C fund were supported by 20EMA yesterday...mid-point of Bollinger bands (dotted line)
Today, while RSI is starting to move upward on S and C fund, MACD still looks like there will be a negative cross below its signal line. Will see if that happens.
Best wishes and hope you have a wonderful weekend! :smile:

01 - S FUND - DWCPF DAILY.png

02 - C FUND - SPX DAILY.png

03 - I FUND -EFA DAILY.png

04 - F FUND - AGG DAILY.png
 
Charts before noon cutoff.
Market looks to be moving sideways.. S and C funds while I fund looks like it wants to start moving upward although it is hitting 48-50 EMA resistance.
Best wishes to you all ! :smile:

01 - S FUND - DWCPF DAILY.png

02 - C FUND - SPX DAILY.png

03 - I FUND -EFA DAILY.png

04 - F FUND - AGG DAILY.png
 
here are charts before cutoff. I drew in circles to display the head and shoulders appearing in both S and C fund. This has been forming for quite sometime....Tom has mentioned it in his Daily commentary. My understanding is that when that right shoulder fully forms, the market can drop from there. We are at that point. It does not always happen but something to be watched.

01 - S FUND - DWCPF DAILY.png

02 - C FUND - SPX DAILY.png

03 - I FUND -EFA DAILY.png

04 - F FUND - AGG DAILY.png
 
Weekly charts...interesting!
​Interesting indeed, especially how C and I Funds have fought hard and have mostly regained from the Oct. '22 lows back to the Jan. '22 levels, and how S Fund still struggles to come anywhere close.
Love it ! ! ! Good Stuff. . . . .
:fing02::fing02::fing02:
 
Thank you Epic! ...and checkout how the July 2023 high got higher than the January 2023 high and also August 2022 levels on the WEEKLY charts (post #5257). Makes me wonder if we are going into an overall uptrend for C and I funds?? :smile: Here are the DAILY charts before noon cutoff. :D

01 - S FUND - DWCPF DAILY.png

02 - C FUND - SPX DAILY.png

03 - I FUND -EFA DAILY.png

04 - F FUND - AGG DAILY.png
 
Back
Top