Where was 666 seen?Thanks Felinecrl and FelixtheCat. So just a bit ago, I finally had chance to see what happened in markets. Not surprised. Oh gosh Felix, the 666 would spook me too! Definitely agree with your points, and it does look like C fund is following S fund. Thank you for articles and charts!
-
The Forum works well on MOBILE devices without an app: Just go to: https://forum.tsptalk.com
-
Please read our AutoTracker policy on the IFT deadline and remaining active. Thanks!
-
$ - Premium Service Content (Info) | AutoTracker Monthly Winners | Is Gmail et al, Blocking Our emails?
Find us on: Facebook & X | Posting Copyrighted Material
-
Join the TSP Talk AutoTracker: How to Get Started | Login | Main AutoTracker Page
You are using an out of date browser. It may not display this or other websites correctly.
You should upgrade or use an alternative browser.
You should upgrade or use an alternative browser.
DreamboatAnnie's Account Talk
- Thread starter DreamboatAnnie
- Start date
felixthecat
TSP Analyst
- Reaction score
- 43
- AutoTracker

Where was 666 seen?
Some individual stocks I follow showed the 666 and the DWCPF or S fund website I track also showed 2166.6 which gave me some thought that bad things were to follow.


 This morning looks like that omen is coming true. Of course there are real indicators that forecast this was coming anyway.
DreamboatAnnie
TSP Legend
- Reaction score
- 1,045
Hi Felix, I also looked at charts and they look very familiar! Lol... Those look like my charts that I used for a short time years back as they are red, white and blue and contain the extra MACD indicators with 3,13, 39 and 3,39,3 settings , but 3,39,3 is the correct one. But this morning, I tried the links to my old charts and they no longer work??????
Those were kind of experimental in that I was just tracking them to see how good they work in showing momentum and to study whether I should use them in decision making. They are similar only because I could not remember the exact settings. He was a person who was on another TSP forum and a TSPtalk member posted about the seasonality-based methodology used by Mstrzerg.
In any case, his methodology involved using the seasonally-specified dates spread throughout calendar year with the TSP fund specified to enter or exit market. But, Mstrzerg had posted that the decision to enter or exit on specified date should be modified depending on whether the MACD setting (one of those with 39 in it) was turning over. I very briefly looked at the two settings for our current market and 3,39,3 looks to have legs but it whipsaws and Slow Stichastic still favored. So, I will consider adding it to my current charts just to study once more.
I’m with DB. Saw 666 come up today while trading. Gave me the hibbie jibbies. S Funds is not oversold yet and the MACD blocks are getting larger on that negative side. I definitely prefer C fund but gotta say it looks like it is going south and about to crossover to the dark side as well on the MACD. We need a correction on C fund and will get it as it follows the S fund.
https://stockcharts.com/h-sc/ui?s=$DWCPF
https://stockcharts.com/h-sc/ui?s=$SPX
Markets Diary
https://money.cnn.com/data/fear-and-greed/
Nice charts there DB!
Last edited:
DreamboatAnnie
TSP Legend
- Reaction score
- 1,045
Charts
S fund not as ugly as it was earlier. Price is at top of red empty candle at this time.


S fund not as ugly as it was earlier. Price is at top of red empty candle at this time.
DreamboatAnnie
TSP Legend
- Reaction score
- 1,045
Well...its time to exit F fund, but where? Did make some during very short term parking of two days.
Charts


Charts
DreamboatAnnie
TSP Legend
- Reaction score
- 1,045
Keep thinking the hammer may drop once more. C Fund and I fund look better. Will see...
But, S fund did drop below Slow Sto 20 and now rising, so that is typically an entry signal, but will it drop more?
Decision made to enter:
S fund 30, I fund 35, C fund 35
But, S fund did drop below Slow Sto 20 and now rising, so that is typically an entry signal, but will it drop more?
Decision made to enter:
S fund 30, I fund 35, C fund 35
DreamboatAnnie
TSP Legend
- Reaction score
- 1,045
Hi MMK, For now it looks good. Loving today's bounce! 
Best wishes to you! :smile:
Best wishes to you! :smile:
DreamboatAnnie
TSP Legend
- Reaction score
- 1,045
Charts. Nice bounce going on!... Even after yesterday's monster recovery from Monday's drop. But even so, S Fund still looks to be making lower highs and lower lows (short term downtrend, brown stair steps) but in mid-term (see purple line) it did make a higher low (so its neutral) until it breaks through the upper part of midterm (blue box) trading range. I fund is still in down trend, but will see how it does. So not sure when I will need to jump off the S /I funds. C fund is clearly still in uptrend. But will see... If S fund can break above blue box, that would change everything. Will be watching momentum in Slow Stochastics.
Best wishes to you all! :smile:


Best wishes to you all! :smile:
Last edited:
DreamboatAnnie
TSP Legend
- Reaction score
- 1,045
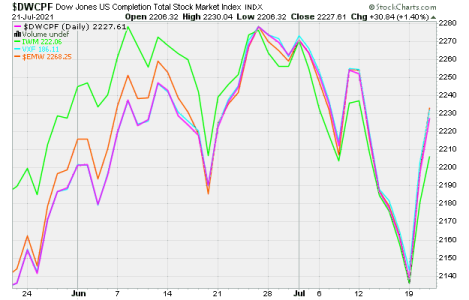
Here is comparison of DWCPF (S Fund) to the iShares Russell 2000 ETF (IWM), Vanguard extended market ETF (VXF) and the Wilshire 4500 completion index ($EMW).
Best wishes!

Best wishes!
DreamboatAnnie
TSP Legend
- Reaction score
- 1,045
Here is comparison of DWCPF (S Fund) to (1) the iShares Russell 2000 ETF (IWM), (2) Vanguard extended market ETF (VXF) and (3) Wilshire 4500 completion index ($EMW).
The Russell 2000 does move seemingly in same direction with the S Fund, but does vary quite a bit and definitely more than the other two and that is likely because it is not even 50% of the 4500 or so stocks of DWCPF index.
Vanguard ETF tracks it very well and almost mirrors it. The Wilshire 4500 should track DWCPF very closely, but it does vary some. I believe it could be due to how the stocks are weighted between these two indexes, but I am not sure. If anyone knows, please comment.
Best wishes! :smile:
View attachment 50027
Attachments
Last edited:
DreamboatAnnie
TSP Legend
- Reaction score
- 1,045
The best explanation I could find is on TSPTalk! Appears difference is based on how company stocks are weighted. Per link below, DWCP o($EMW??) only looks at the TOTAL amount of shares, where the DWCPF looks at the AVAILABLE shares.
https://www.tsptalk.com/mb/the-s-fund/3413-dwcp-dwcpf-difference.html
https://www.tsptalk.com/mb/the-s-fund/3413-dwcp-dwcpf-difference.html
- Reaction score
- 2,991
The best explanation I could find is on TSPTalk!
From 2005.
I wonder whatever happened to Griffin. He told me he was had to leave for a while (military I believe) and that was it. Never heard from him again. :usa2:
DreamboatAnnie
TSP Legend
- Reaction score
- 1,045
Charts. I want to Exit S fund... It just stinks! 


DreamboatAnnie
TSP Legend
- Reaction score
- 1,045
Gorilla glue worked yesterday and glad I stayed in. charts


DreamboatAnnie
TSP Legend
- Reaction score
- 1,045
Here are some charts to mull over. Tech reports earnings this week, but in reading James' post under Thread, Extraordinary Measures and the G Fund. I understand Yellin may take some actions to try to keep US within debt ceiling... By July 30 when current suspension of limit ends. I guess Congress will need to act, etc.
https://www.tsptalk.com/mb/business-news/37232-%C2%93extraordinary-measures%C2%94-g-fund.html. "Yellen said her first move on July 30 will be to suspend the sale of state and local government securities, which are used by some local jurisdictions to meet some of their financing needs but increase the level of debt held by the federal government."
In any case, S fund continues to look weak as does I fund. Again contemplating reduction in exposure. Also, per Whipsaws thread, first week in August is sometimes one of worse weeks. I dunno if it will happen again, but in looking at hourly charts, looks weak too.
Last edited:
DreamboatAnnie
TSP Legend
- Reaction score
- 1,045
Its turning slightly positive now. I am staying all in for now. Ughh.. I hate the market! :blink:
DreamboatAnnie
TSP Legend
- Reaction score
- 1,045
Charts.


