Okay, just so we all understand, I did explain how to use NAAIM in some detail within the past 2 years or so. It is in my thread somewhere, but I know it's somewhat tedious to dig out.
First, do not let all the columns and numbers mystify you. Your don't need to understand all of the specifics about what these numbers mean in great detail. Even I do not know exactly how they come up with the readings in the columns beyond a somewhat superficial perspective. But I only need to see how the smart money is positioning each week (week to week) to get an idea of what the market may do in the days ahead. Remember, this is "smart money". You do not generally fade smart money. They are considered insiders on some level. Professional money managers. Because the folks on this board (TSP) are not "day trading" their accounts, we only need to get an idea of how the smart money is positioning each week. This is not a surgical reading. You cannot use it to day trade. It comes out weekly only, which is great for folks in TSP since we only have so many trades a month. I know this may sound obvious to some of you, but it needs to be said to make sure we are all on the same page.
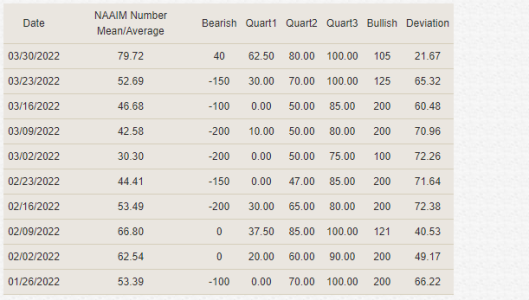
So, here is what you need to know. The MAIN NUMBER to watch is the MEAN/AVERAGE. Which way did it move and by how much? That is primarily what I am looking at.
Now, my basic rule of thumb when determining bullish, bearish, neutral readings is recognizing (generally) where those sentiment readings fall on a scale. The scale that I use (my own scale) is that the upper NAAIM mean/average rarely goes above 110 (bullish), so that's my upper limit (generally). The lower number rarely goes below 30 (bearish). So, that puts neutral at about 70 or so. That's how I determine their overall sentiment.
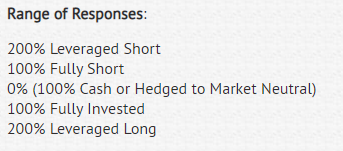
Now, the Bearish and Bullish columns I believe have to do with how much leverage these money managers are using. I don't know how they make that determination, but it's obviously part of the survey they take each week among the money managers. The Quart 1, 2 and 3 columns I believe are groups of money managers, but I do not know how those groups are determined or exactly what those numbers are telling us (I think it also has to do with leverage). I don't care about the deviation column.
Let's keep in mind that good traders often play both sides of the market; especially in times of uncertainly like now. So if you lose in one area, you gain in another. That's how risk can be managed. In TSP, the closest you can come to that is adjusting your cash holdings (G fund) vs stock holdings because you can't short the market.
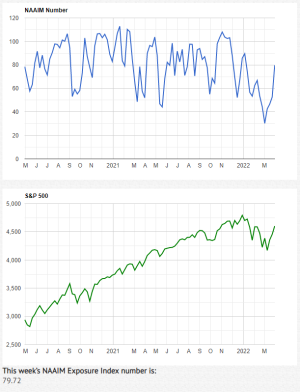
So, looking at this past week, there was a big jump in the mean from 52.69 to 79.72. Well, 59.69 was below my neutral line (70), so they were leaning bearish at that time, but not overly so. This week, the number is above it, so they are modestly to moderately bullish. The higher that number goes, the more bullish the reading and vice versa for bearish readings. So, because they are not wildly bullish (over 90), that tells me they are still at least somewhat wary of the upside. In other words, they didn't jump in with both feet. But collectively, they are still leaning bullish given the mean/average.
One thing about leverage, the more leverage the smart money is using, the stronger their conviction about where they think this market is going. Make sense? So as those numbers go up and down, so does their conviction.
The reading is most beneficial in full blown bull markets with minimal volatility. You can successfully use this reading for months and months under that condition and get it right for long periods of time. We are not in that kind of market right now. It is interesting though that this latest reading is the highest in many weeks. But the reading itself is not heavily bulled up (as I said previously), so we'll have to watch how things go in April and beyond.
I hope this helps.
 Your posts are always a must read and I have also really enjoyed your insights on those things seen and unseen.


