coolhand's Account Talk

Sorry for the absence. Had to leave my home and computer for another week to attend to a private family matter. Got back home and my main computer isn't working.

Welcome back! Hope everything will be ok! I think a lot of people here missed your input including me, but family comes first.
 
I have not even looked at the stock market in more than a week, so let's see what we have.
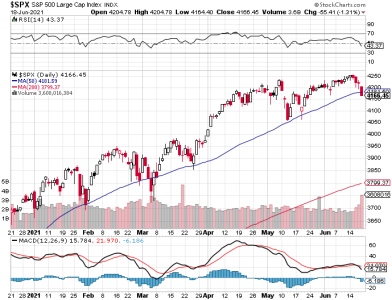
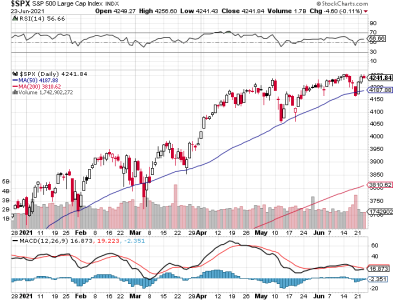
S&P 500.png
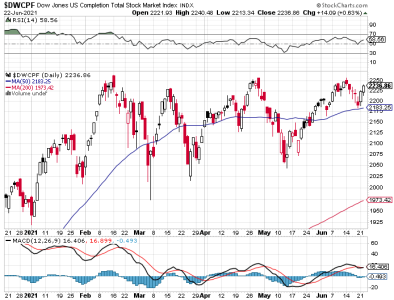
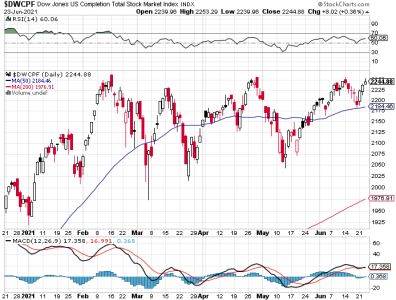
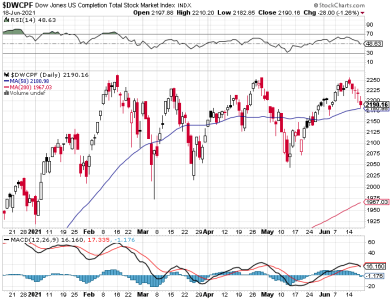
DWCPF.png

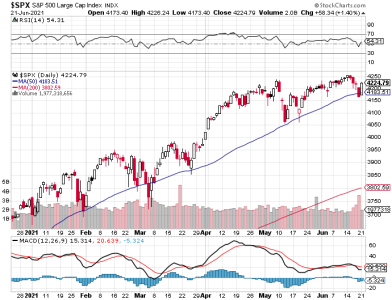
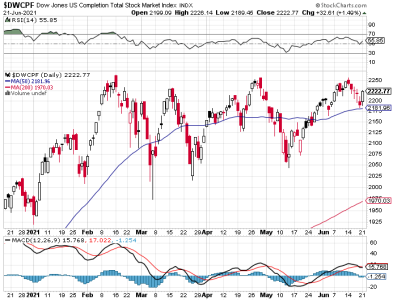
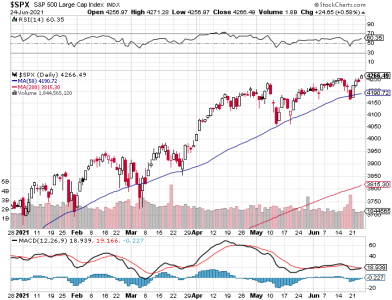
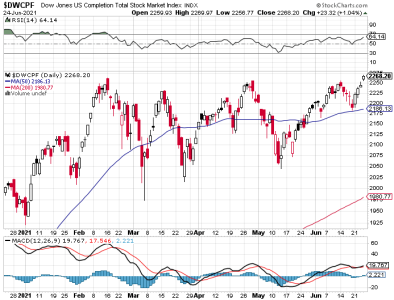
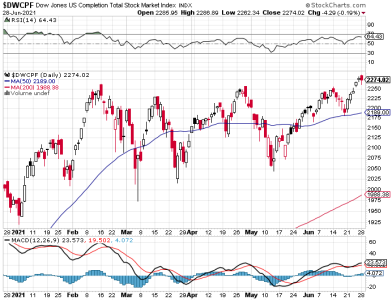
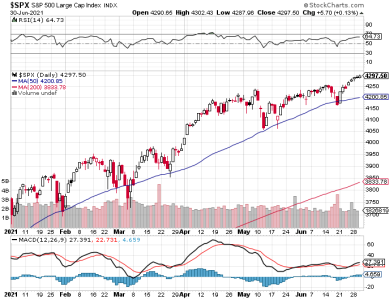
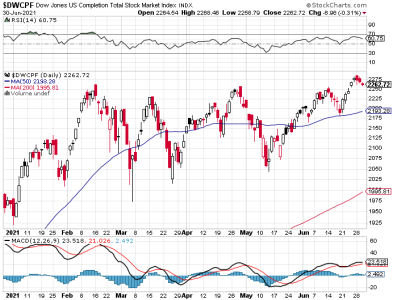
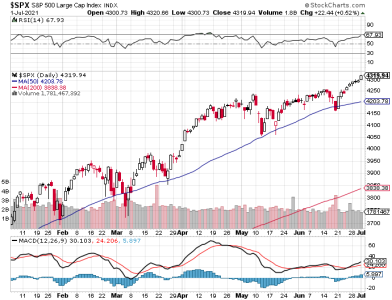
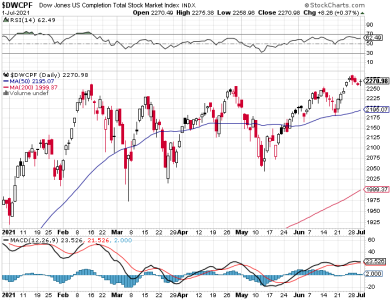
Obviously, the past week was not favorable to the bulls. Price closed below the 50 dma on the S&P and is testing that average on the DWCPF. But I do see that the S&P hit a fresh, closing all-time high a few days ago. That didn't last long. Volume was also heavy on Friday. Momentum is falling on both charts and is also negative.
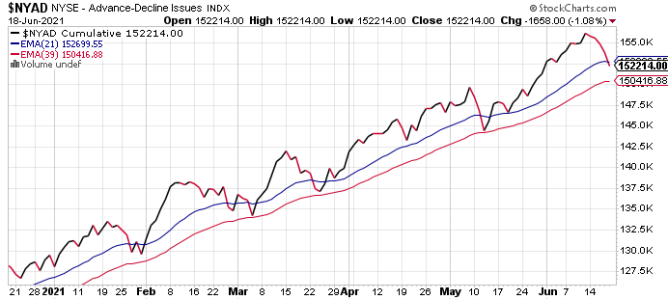
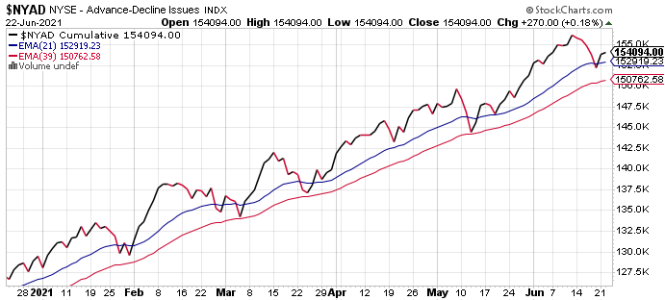
NYAD.png

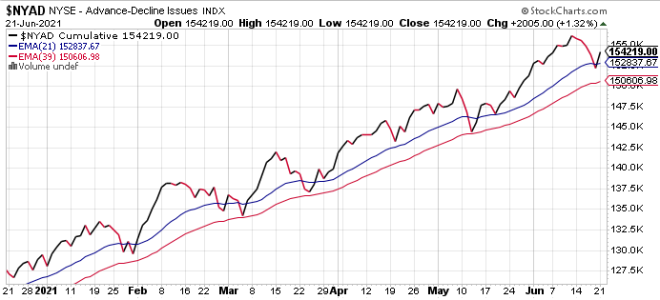
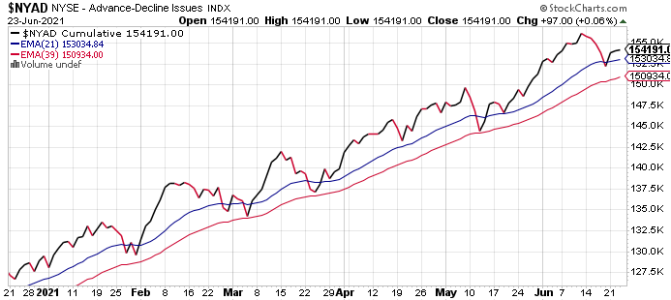
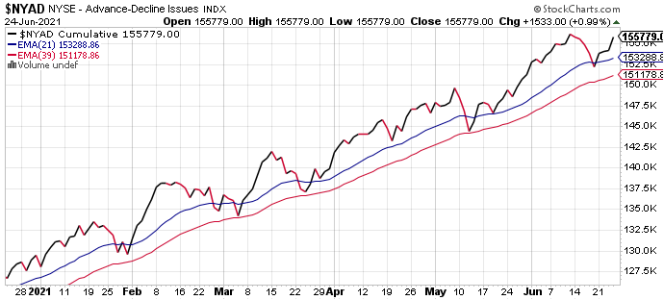
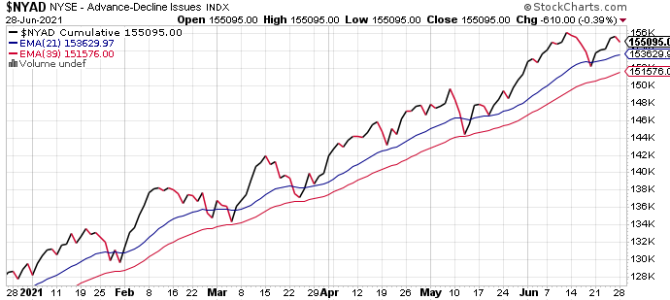
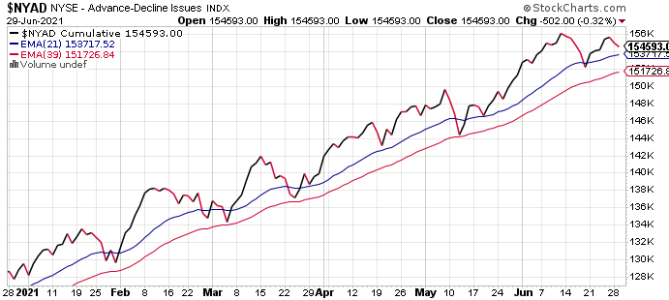
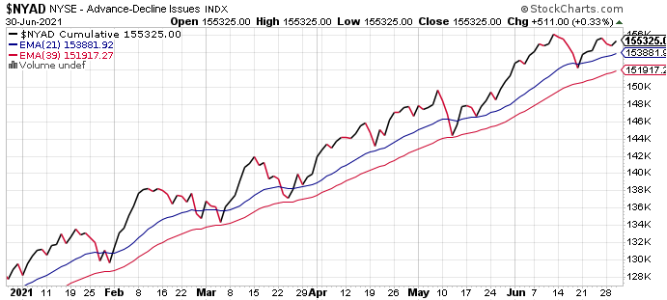
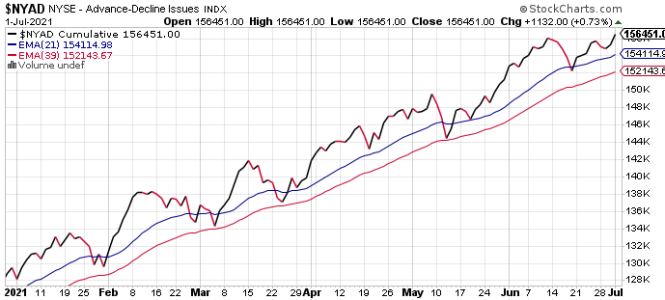
Breadth went negative on Friday and has been falling for about a week.

So, we have a short-term(?) down cycle that is now turning indicators negative. Last week, NAAIM was somewhat bullish overall, but this week they have increased their leverage on the long side, but a small bear contingent within their group is modestly playing the short side. The reading is solidly bullish overall. Our TSP sentiment survey is neutral.

Since the smart money is not only not backing off their bullishness (it increased), but increasing their leverage on the long side, I suspect a bottom is likely near. The indicators going negative at the end of the week supports that perspective as well. But our own survey is neutral (and some NAAIM managers are modestly bearish), so maybe the market chops around for a bit first. I will remain bullish on the S&P and neutral to modestly bullish on a the DWCPF, but I am anticipating that it may be a few days before the long side gets traction again. We'll see.
 
The MACD on the charts u provided are rolling over with the blocks trending negative. I saw very unusual spike in trading volume on Friday's selloff during the last 30 minutes. The NYSE volume during the last 30 minutes was more than twice the volume for the trading day up to that point. Appears that advancing issues have been declining all week & the declining issues accelerating. I did not sense an exhaustive sell on Friday...felt more like a wave down starting to me. What has got me concerned is inflation numbers are more serious than the Federal Reserve is telling us. I do expect interest rates to rise early next year instead of 2023. Key indicators that will slow the economy down...high material costs, shortages in the chip industry, housing prices, energy, food, auto prices, and expanding debt. Easy money will become tight & companies that have propped up their stock with stock purchases will find their debt levels difficult to manage putting a drag on earnings. We need to get back to more reasonable market P/E numbers. We are near the dotcom bubble bust. Growth stock rotation is where the money is going. I see overbought conditions there though. Profit taking soon. Expect market to decline short term. We need a bigger correction or I fear stock growth will be lethargic.
 
I don't disagree with you at all. You are correct. But a manipulated market does not care about reality. It's all smoke and mirrors. Eventually, reality does catch up with the manipulators, but that usually takes years. Having said that, it's been years so maybe we are approaching something more profound. Smart money says we aren't there yet, but you can never be entirely sure.
 
I had suspected a bottom may be near, but thought it might be a few days yet before the market got solid upside traction. It was more like a few hours. The very next day the market reversed and tacked on sizeable gains.

S&P 500.png
DWCPF.png

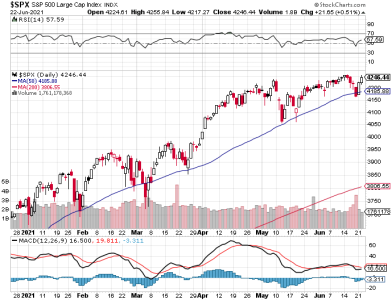
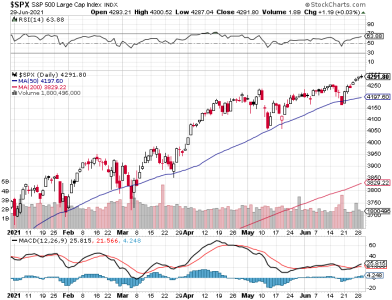
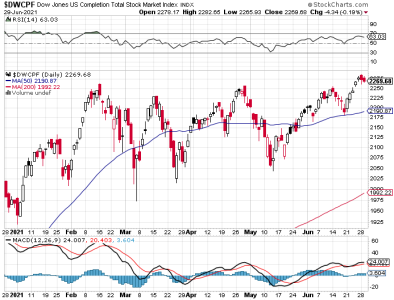
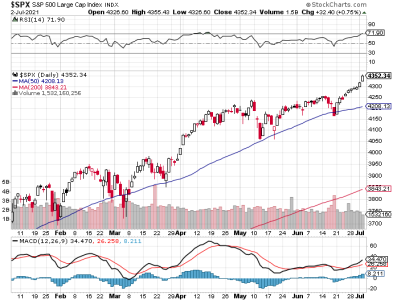
Price snapped back to the upside off support at the 50 dma on both charts. Momentum halted its downward movement for now. Strength (RSI) ticked higher.

NYAD.png

Cumulative breadth also snapped higher and flipped back to positive in the process.

The short term downward cycle may be over. Monday's rally may be strong enough to turn momentum back up. The DWCPF has still not broken out of its long-term sideways dance and that could keep a lid on the upside. I remain bullish on the S&P and neutral to modestly bullish on a the DWCPF.
 
So is this the end of sell in May and go away? I've been sitting on the sidelines chomping at the bits....

Sent from my Pixel 4a using Tapatalk
 
Much to the consternation of those sitting on the sidelines, the market made it 2 in a row today as the bulls pushed price back up near resistance once again.

S&P 500.png
DWCPF.png

Both charts show price not far under its previous high. A test sure looks likely. Momentum is rising, but not so you'd notice much.

NYAD.png

Cumulative breadth ticked higher on the day and that keeps the signal bullish.

It didn't take long for the bulls to recapture much of last weeks losses. NAAIM got fairly bulled up, so I'm thinking there's more upside. The question is, can price get past resistance; especially on the DWCPF.

I remain bullish on the S&P and neutral to modestly bullish on the DWCPF.
 
It was a rather choppy affair today that culminated in a mixed close. The biggest takeaway for me on today's action is that resistance remains an obstacle.

S&P 500.png
DWCPF.png

Not much to read into today's charts. Price is bumping up against resistance and so far it's holding. Momentum is rather neutral.

NYAD.png

Cumulative breadth ebbed higher just a tad and remains bullish. Unfortunately, it would not take a ton of selling pressure to flip this signal negative again. Just sayin'.

So, nothing has changed so far. Resistance continues to hold, but be we do have a bullish NAAIM, which suggests the market will break through to the upside sooner or later. It is not lost on me all the bad news out there; especially inflation as well as Fed jawboning. These are the current headlines to drive the wall of worry. Don't get wrong, these things are issues, but trying to leverage them for profit (timing wise) is quite difficult. That's why I point to NAAIM. But even they can wrong at times.

I am not sure if the market is going to punch through to the upside or head back down. The smart money is betting on the upside. That is usually a reasonable indicator to help make decisions.

I remain bullish the S&P 500 and neutral to modestly bullish the DWCPF. NAAIM reports tomorrow.
 
Okay, the latest NAAIM reading shows they are backing off their bullishness. They are now largely neutral to slightly bullish. I anticipate a pullback at any time. I am now going neutral.
 
The chop was gone today as the bulls made it a one-way street as the averages closed out with solid gains on the day.

S&P 500.png
DWCPF.png

Price on the both charts broke through resistance and closed with fresh all-time highs. Momentum is rising as is strength, but it's too soon to get excited about the upside.

NYAD.png

Cumulative breadth spiked to the upside and remains bullish.

Now, the fly in the ointment. NAAIM backed off their bullishness by a good bit. They didn't go bearish, but appear to have taken some profits as they are now collectively neutral to modestly bullish. Interesting. Do they know something? We're going to know soon enough. I'm not expecting anything dramatic, but I do think some selling may be coming our way soon. Now, having said that, futures are soaring. Something smells fishy to me.

I am now neutral. With NAAIM going neutral after fresh all-time highs and with futures soaring to boot, it would seem something may be about to happen, but I have no idea what. I just have this funny feeling with what I am seeing.
 
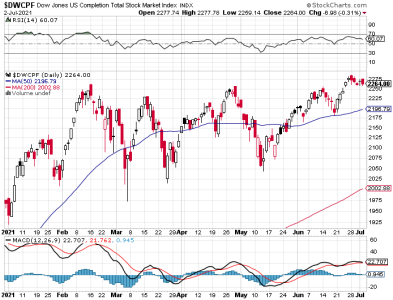
After a week of selling the week before last, the bulls got busy and sent price on the S&P and DWCPF to new all-time highs last week. In fact, the DWCPF is now up 5 days straight after finally breaking through a multi-month trading channel.

S&P 500.png
DWCPF.png

The charts speak for the themselves as price slashed through resistance to close out the week with solid gains. And the DWCPF led the S&P, which is what we want to see if we're bullish (or want to be bullish).

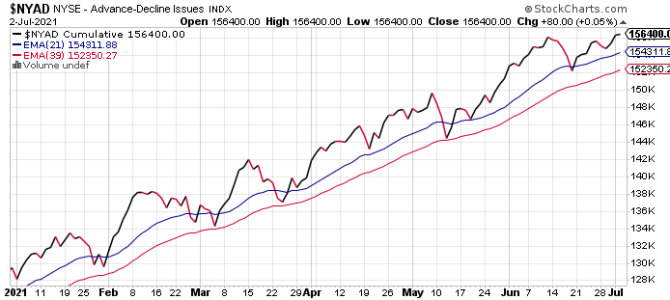
NYAD.png

Cumulative breadth ticked higher on Friday and remains bullish.

Our TSP Talk sentiment survey came in very bullish. I have said several times in the past that I don't treat our sentiment survey as a contrarian indicator. Especially if we're bullish in a bull market. Interestingly, NAAIM scaled back their bullishness to a neutral to modestly bullish reading. That still has me wondering if some selling is near. It isn't unusual after a change in NAAIM reading for the market to continue moving in its current short term direction for a day or two before reversing, so maybe we see some selling early next week. I also said I'm not looking for anything dramatic even if we get some selling. The problem is, we are bullish here on TSP Talk so the downside may not be much at all (if we get any short term).

I went neutral after the last NAAIM reading and I'm going to remain neutral for the time being. Let's see what the new week brings.
 
The new week started out mixed as Monday saw the S&P rise modestly, while the DWCPF fell modestly.

S&P 500.png
DWCPF.png

Both charts remain bullish. But with a neutral to modestly bullish NAAIM is some selling still on tap? We got some in the DWPCF, but is there more? Futures are rather flat right now.

NYAD.png

Breadth fell and that may be a tell for more selling, but I can't be sure.

I'm going to remain neutral for now.
 
The bulls started the morning session with gains right out the gate, but then the market chopped around for an hour or so before choppy lower the rest of the day. The close was mixed once again with the S&P posting a modest gain, while the DWCPF posted a modest loss.

S&P 500.png
DWCPF.png

So far, this market is showing resilience even with the modest selling in the DWCPF. It feels rather toppy to me, however. Upward momentum is positive, but not inspiring.

NYAD.png

Breadth fell once more, but the signal still remains bullish.

It's been 3 trading days since we got the rather neutral NAAIM reading and I suppose that given the market has been mixed the past couple of trading days, we could say that to this point they were largely accurate. But if you are looking for a buying opportunity, you probably are not liking this resilience. But the week isn't over and the action seems tired, so maybe more weakness manifests. I remain neutral.
 
Both the bulls and the bears have something to be happy about depending on the index you follow. The S&P made it 3 straight up days at the same time the DWCPF declined 3 days.

S&P 500.png
DWCPF.png

So, while the S&P continues to rise, the DWCPF continues to fall, but not enough to cause an serious technical damage (so far).

NYAD.png


Breadth ticked higher on the day remains bullish.

Obviously, the 2 indexes won't continue to move opposite directions forever. A pullback by the S&P remains very possible. I remain neutral.
 
So much for the downside and mixed closes. Thursday's trading saw both the S&P and DWCPF post gains.

S&P 500.png
DWCPF.png

Price on the S&P appeared to be losing steam until Thursday, when the bulls spiked it to the upside. The DWCPF broke its 3 day losing streak with a somewhat modest gain. Both charts are bullish, but the S&P would seem to be a more favorable index as upward momentum is rising on the S&P, but flat on the DWCPF.

NYAD.png

Cumulative breadth rose and remains solidly bullish.

The latest NAAIM reading saw these money managers largely turn off their limited shorts and ramp up their long exposure. The reading is back to bullish.

When NAAIM went neutral the week before I said I wasn't expecting anything dramatic, but that the possibility for some selling had gone up. We did get some selling, but only in the DWCPF. We'll have to see now if the DWCPF can keep today's reversal going.

I am moving to bullish on the S&P, but will remain neutral on the DWCPF.
 
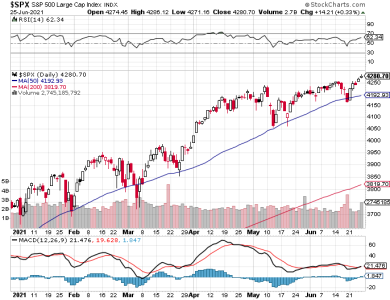
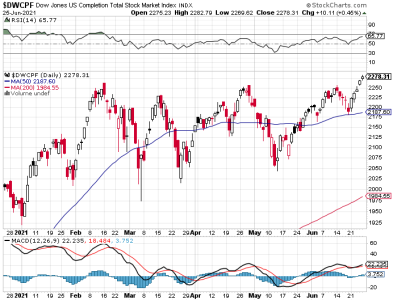
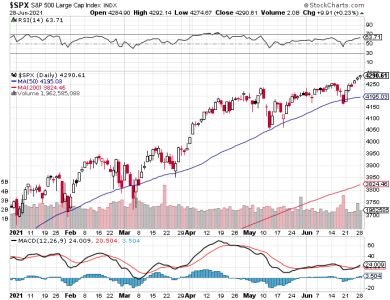
The disparity between the S&P and the DWCPF continued last week, as the S&P soared to fresh all-time highs, while the DWCPF posted a moderate weekly loss. But that statement may be a bit misleading as the DWCPF remains a bullish chart overall and one that could join the S&P in fresh highs should money flows turn toward small caps with more consistency.

S&P 500.png
DWCPF.png

Of the 2 charts, it's obvious that the S&P is more bullish. Strength and momentum are rising on the S&P, while at the same time are falling modestly on the DWCPF.

NYAD.png

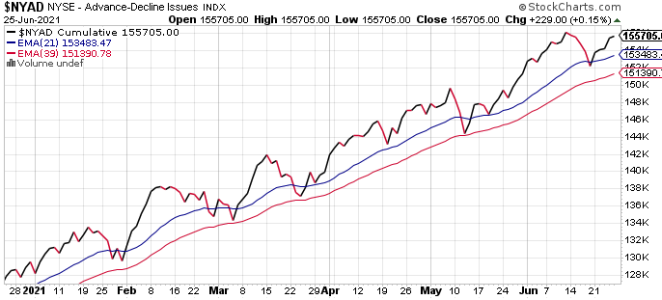
Cumulative breadth closed out the week in good shape with the signal still above the rising EMAs.

As we begin a new trading week, NAAIM is solidly bullish having increased not just their bullish sentiment, but their leverage on the long side. The TSP Talk sentiment remained heavily bulled up.

I remain bullish on the S&P and neutral on the DWCPF.
 
Back
Top