Bear Cave 2 (Bull Allowed)

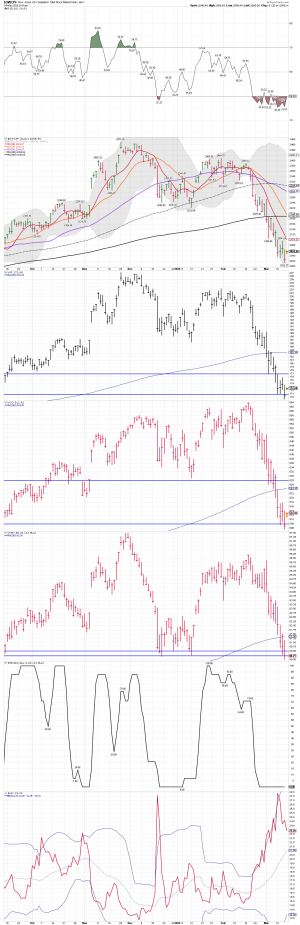
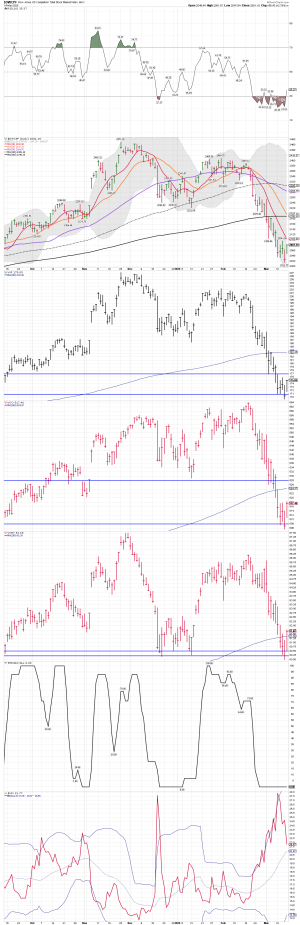
Sell the Rip is in play! We shall see if buyers come back in before the close. However, higher lows could work out if we can grind higher.

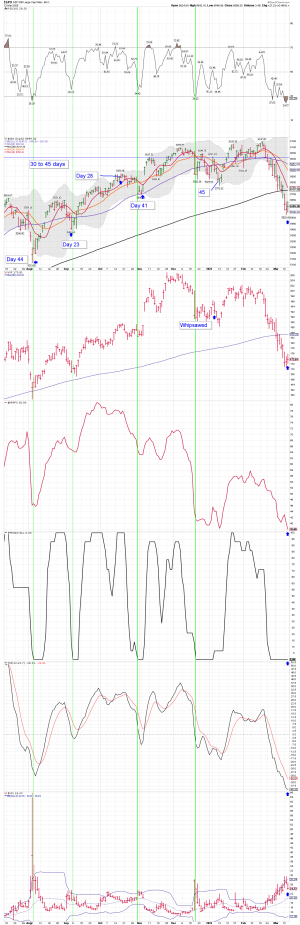
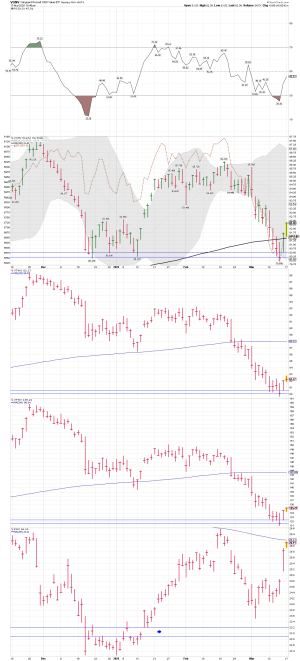
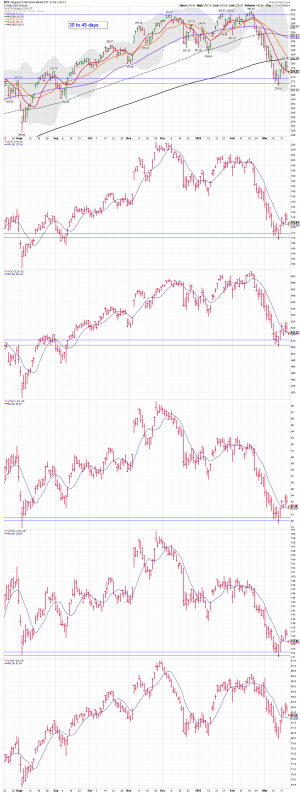
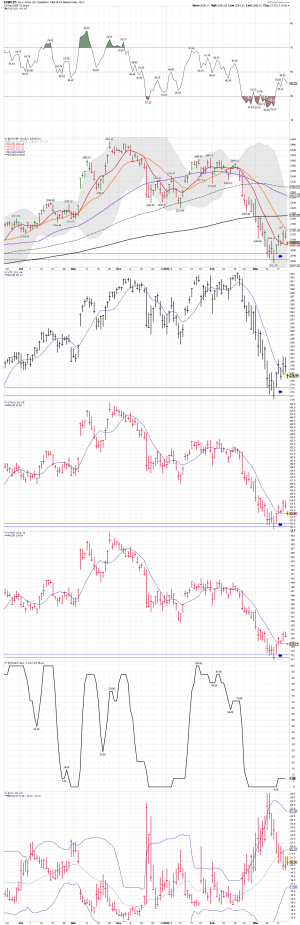
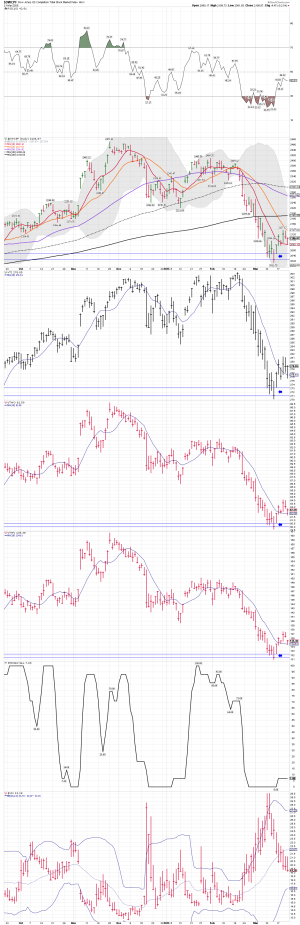
Daily trading charts: I bought some shares of VONV.... It made a lower low this morning after a nice Rip up...
 

Attachments

  • $DWCPF (23).png
    $DWCPF (23).png
    147.8 KB · Views: 24
Last edited:
VIX daily and my daily trading chart: With 2 hours to go looking much better. We shall see how the VIX buy signal plays out. A very nice bounce off the lows for most of the indexes. Waiting to see if buyers sell again before the close.

Long - VOO,VXF, NVDA, and VONV. Selling NVDA before the close. Out of NVDA @ $115.99 and might trade it again....
 

Attachments

  • $VIX (1).png
    $VIX (1).png
    83.5 KB · Views: 7
  • $DWCPF (1).png
    $DWCPF (1).png
    147.9 KB · Views: 8
  • NVDA (1).png
    NVDA (1).png
    70.6 KB · Views: 5
SPX DCL: We shall see how it plays out....

SPX daily chart: The oversold indicators do look very good on the daily chart for a bounce.

Bottom Line: The odds for a bounce continue to increase.


Stocks (finally) formed a swing low on Wednesday.
Stocks printed their lowest point on Tuesday, day 38, placing them in their timing band for a daily cycle low. Wednesday’s swing low signals the new daily cycle. We will need to see a close above the converging 10 day MA and 200 day MA in order to label day 38 as the DCL. Stocks are currently in a daily downtrend. Stocks will remain in their daily downtrend unless they close above the upper daily cycle band.
 

Attachments

  • $SPX (14).png
    $SPX (14).png
    198.5 KB · Views: 6
Last edited:
Daily tracking chart: Some indexes hitting a new low since the start of this selloff...

I added a few more shares of VXF, and VTI. I have limit orders placed for some additional shares of VNOV.
 

Attachments

  • $DWCPF (24).png
    $DWCPF (24).png
    182.5 KB · Views: 5
Last edited:
Daily indexes after the close.: The move lower continues as any move higher continues to be sold.

I remain long.
 

Attachments

  • $DWCPF (26).png
    $DWCPF (26).png
    182.6 KB · Views: 5
Last edited:

If a market belief has become so prevalent that even my wife is talking about it, then it is a sure-fire sign we’ve ventured into “extreme territory” and we’re on the cusp of a reversal.

The S&P 500 traded as low as 5530 on Tuesday.

At that point, the index was down 10% from the February high – putting it in “correction” territory. We now have extremely oversold technical conditions.

Investor sentiment, a contrary indicator, is as bearish as it has been since the Covid-inspired correction of 2020.

The Volatility Index has generated a cluster of five buy signals in just the past two weeks. We’re entering the seasonally bullish period of the second half of March.

And, Gabriela heard the stock market is about to crash.

It looks to me like everything is lining up for one heck of an oversold bounce.

Best regards and good trading,
 

Attachments

  • dailytrading.png
    dailytrading.png
    179.5 KB · Views: 11
I reduce some shares on Friday before the close.... I continue to mainly be ST trading.... Waiting on the next tariff comments, before adding or buying again.

For now, I remain long based on the oversold daily charts.


When investors sell stock-market "rips" during a downdraft, it signals that they're not confident that any short-term gains will hold. That's why the pattern of lower daily lows, and lower daily highs, that investors have seen since the S&P 500 peaked on Feb. 19 is so concerning, said Scott Bauer, the founder of Prosper Trading Academy and a former market maker on the Cboe, formerly known as the Chicago Board Options Exchange.

"This is a sell-the-rip market, not a buy-the-dip market," Bauer told MarketWatch. "It shows that investors are definitely not confident right now."
 

Attachments

  • $DWCPF (27).png
    $DWCPF (27).png
    180.4 KB · Views: 12
Last edited:
It does look like a DCL. We shall see if it has legs and the SPX can get get back above the 10 day MA, and continue moving higher. The PMObuy did turn up. A nice move by the S Fund after the bloodbath phase, and now a move back above the 10 day MA. The indexes I trade all moved back above the 10 day MA which is a buy signal. However, I'm currently only ST trading right now. As was pointed out the DCL looks to be in, and some indexes are looking good for a new daily buy signal. We shall see how it plays out. Will the indexes, back test the lows, maybe make a higher low, just grind higher, or could we see LT daily cycle....

My daily trading chart:


Stocks printed their lowest point on Thursday, day 41, placing them in their timing band for a daily cycle low. Friday’s swing low signals the new daily cycle. While stocks rallied on Monday, they were unable to close above the 10 day MA. Normally, we need to see a close above the 10 day MA in order to label day 41 as the DCL — but today, I’m calling it based on the NYSE.
 

Attachments

  • $DWCPF (28).png
    $DWCPF (28).png
    194.5 KB · Views: 8
Last edited:
We shall see how the monthly data plays out in the weeks ahead.
 

Attachments

  • a.png
    a.png
    191.5 KB · Views: 9
Last edited:

The Market Finally Looks Ready to Bounce​

BY JEFF CLARK, EDITOR, MARKET MINUTE

Finally… after a brutal, three-week decline in the S&P 500, the stock market looks ready to bounce.

It’s about time. We’ve been anticipating a bounce for the past several sessions. But it took five Volatility Index (VIX) buy signals and a “crash alert” comment from my wife to finally kick the bounce into gear.


It could happen, of course. The market is in a seasonally bullish period between now and the end of the month. We have a cluster of VIX buy signals. And investor sentiment (a contrary indicator) is bearish enough to provide a lot of fuel for a strong bounce.

But, that bounce has to push the S&P 500 back above its 50-day MA (5935-ish) before we can be confident the bull is still kicking. Otherwise, the S&P will form a lower high on this move, and then turn lower.

If that happens, traders should expect lower stock prices as we head into summer and fall.

Best regards and good trading,


Attachments

  • $SPX (2).png
    $SPX (2).png
    197.5 KB · Views: 10
Monthly tracking indexes: For now, all remain below their 10 month MA. There is still no confirmed data that the YCL is in.

Tracking! IWM remains below its 2021 high. That is not what we want to see......
 

Attachments

  • $SPX (16).png
    $SPX (16).png
    193 KB · Views: 7
Daily tracking indexes: They are grinding higher and remain above their 10 day MAs in early trading. However, I'm flat again as I wait to see how the tariff war plays out. I never get into stocks because I have the FOMO bug. We shall see if the Bulls can hold stocks above these 10 day MAs as we close out the rest of the month.
 

Attachments

  • VTI (6).png
    VTI (6).png
    141.6 KB · Views: 7
  • $DWCPF (30).png
    $DWCPF (30).png
    178.4 KB · Views: 5
Last edited:
Maybe it will be Big, but for now I want to wait and see how the April Tariffs play out. A ICL would be nice for a multi-week run in the weeks ahead. The cycle data does indicate a ICL is in play... If this is a ICL, then the monthly SPX trend should move back above the 10 month MA fairly quick. We shall see how this weekly cycle plays out.

This is Big !​

March 22, 2025
 

Attachments

  • VTI (7).png
    VTI (7).png
    106.6 KB · Views: 4
  • $SPX (17).png
    $SPX (17).png
    192.9 KB · Views: 4
The AIIBull/Bear spread is telling us a bounce could happen soon. However, is the current marker like the one at 2022 May or September levels (First chart). We shall see how these markers play out. I posted some other data on the charts below. Times are a tad different right now with the tariff talk going on. I wait and have NO FOMO. If this is a ICL, and a YCL there will be plenty of time to chase.

Bottom Line: The monthly indicators are improving, but I'm going to wait until April. If the tariffs don't go into play we could see a nice bounce. I'm sure some in the Trump circle will know in advance, but since we have to guess I will play it safe.

Keep in mind that Stocks are deep into this cycle for a YCL. We shall see how it plays out.
 

Attachments

  • $SPX (21).png
    $SPX (21).png
    92.4 KB · Views: 5
  • $SPX (22).png
    $SPX (22).png
    101.4 KB · Views: 5
  • $SPX (24).png
    $SPX (24).png
    192.9 KB · Views: 4
  • $SPX (25).png
    $SPX (25).png
    90.5 KB · Views: 5
  • !AAIIBULL-!AAIIBEAR.png
    !AAIIBULL-!AAIIBEAR.png
    48.6 KB · Views: 5
Last edited:
I'm in my 70's and have most of my cash in notes earning around 4.5% right now, and the rest in VMFXX ( my cash settlement fund) I use for trading. I made plenty of trades this month, but the funds are now back in VMFXX as I wait for April tariffs to play out. The data looks very good for a move higher, but I'll pass.


For now, I'm with Warren Buffett... Cash is King! I do have a trading account to trade extremes. The Boomers are not spending like they use to during these crazy times, and I doubt that will change anytime soon. We shall see if they keep moving out of stocks....


As a reminder, the median age of Baby Boomers is 70 and Americans over the age of 70 own 40% of the stock market and 25% of its residential real estate. To the extent they become aggressive in their “retirement planning” to shore up liquidity to earn a fixed income, this accelerating trend could also prove to be disinflationary for asset prices. For now, that’s not become an existential threat. We’ll know it, however, when Boomers see the same “it” as those noting the spread of discounting and other telltale signs of recession.
 
Last edited:
Daily indexes: The daily data does look good, but I'm remaining flat. I made some nice money from the ST bounce off the lows.


Attachments

  • a.png
    a.png
    178.9 KB · Views: 4
Back
Top