robo
TSP Legend
- Reaction score
- 471
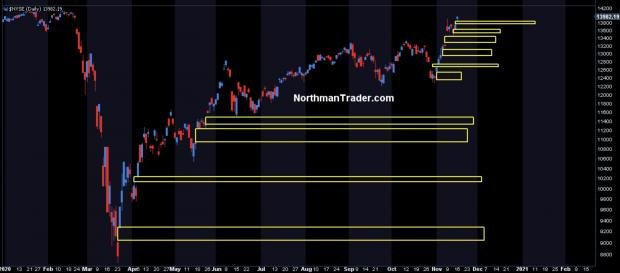
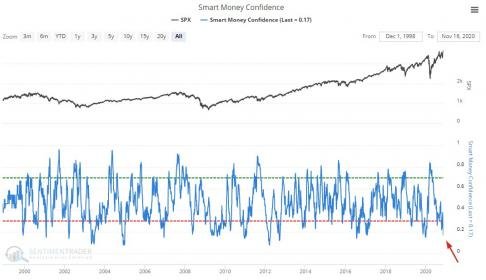
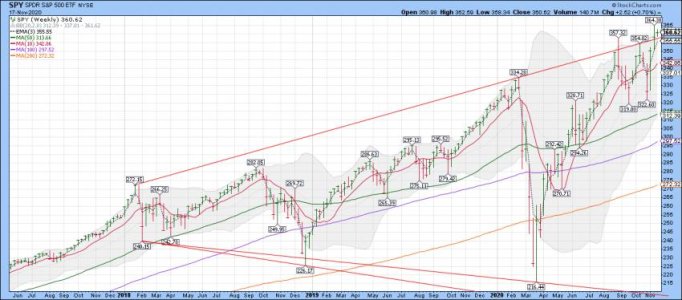
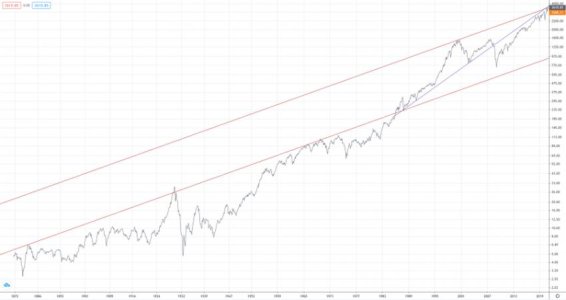
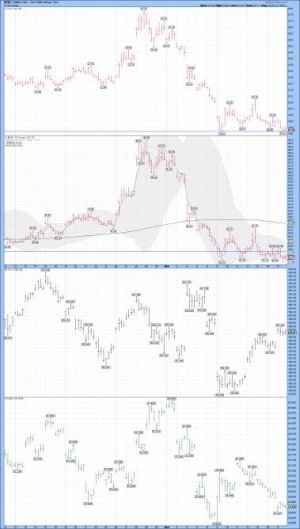
Another go at the all time highs... Time to hedge with a short position. My system remains on a buy signal, and the trend remains up.
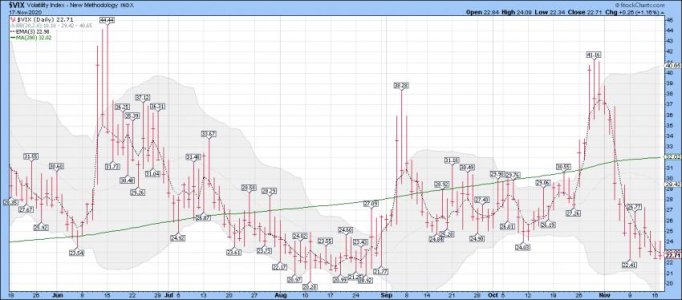
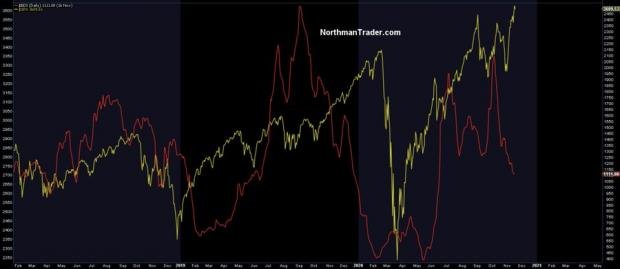
https://twitter.com/jessefelder/status/1327646989262184449/photo/1
https://twitter.com/jessefelder/status/1327646989262184449/photo/1
Attachments
Last edited: