Bear Cave 2 (Bull Allowed)

Chart In Focus
Fed Funds COT Leading Indication

The efforts of the Federal Reserve to inject extra liquidity into the banking system over the past 2 months have helped to fuel the year-end (2019) rally. Questions remain about how long the Fed may choose to keep up that effort, and whether the Fed has enough ink in the printing presses to overcome other market forces.

https://www.mcoscillator.com/learning_center/weekly_chart/fed_funds_cot_leading_indication/
 
A comment about 2007 and 2020


Roboman
Friday 3rd of January 2020 04:16:50 PM
I read lots of comments today about EEM and WTI. Not all here.... So I made a new 2007 historical data chart with those sectors on the chart... I added GOLD, OIL, USD, EEM and XES. One should compare the current data to 2007. The XES, and EEM spike was caused by a huge move from the dollar moving down. Overs? Maybe! I don't really care since I will be trading the trend up or down....

Look where EEM is today and were XES is on the chart. I would be buying XES (value) over EEM but that's just me.... Will it be different this time? Don't know or care since I just trade the trend. The IWM move puts me only trading VXX and TZA until IWM gets back above the 10 DMA. Then I can go long again at Vanguard. I will follow my system even if I get whipsawed.

“There is only one side to the stock market; and it is not the bull side or the bear side, but the right side” Jesse L. Livermore

For now it is waaaay different because of all the money that has been pumped into the markets from the Banksters.... I can't wait to see how it plays out....

Black Line = OIL

Green line = USD

Purple line= EEM

Red Line = Energy

Gold Line = Gold

https://stockcharts.com/h-sc/ui?s=$SPX&p=M&st=2005-01-24&id=p98099287687&a=710961443

Have a nice weekend!

Have a nice weekend!
 
Decade of Living Dangerously, Part 1
BY JOHN MAULDIN JANUARY 3, 2020

Get Ready
While 2020 could bring any of several potential crises to a boil, I think we will more likely have a lot of noise but little real change. I expect more of the same: slow but steady GDP growth in the 1.5% to 2% range, widespread dissatisfaction and polarized opinions on both the economy and politics.

Next week we’ll look further into the coming decade and, as you’ll see, the outlook darkens considerably. This is actually good news, in one narrow sense. We have time to prepare for what’s coming. I personally intend to use 2020 to realign my portfolio, get more liquid, and try to get my businesses in position to take advantage of new opportunities.


https://www.mauldineconomics.com/frontlinethoughts/decade-of-living-dangerously-part-1
 
David Rosenberg


@EconguyRosie
Jan 3
More
Someone forgot to tell the Baltic Dry Index, which has collapsed 60% from the nearby peak, about this “growth stabilization” narrative. Not as if the Cass Freight Index hasn’t been flashing the same signpost, which is tougher times ahead for the over-levered global economy.

https://twitter.com/EconguyRosie?lang=en
 
Gold Cot... I can't wait to see how it all plays out.....


https://stockcharts.com/h-sc/ui?s=$GOLD&p=D&yr=0&mn=8&dy=0&id=p41452102084&a=711055202


Gold-Stock Head Fake
Jan. 6, 2020 3:24 AM ET

Because of the ludicrous risks inherent in hyper-leveraged gold-futures trading, there’s only a relatively-small group of speculators willing to do it. And though their bets are super-amplified, they only collectively command a relatively-small and finite pool of capital. Spec longs almost never get higher than about 425k contracts, that is near their effective ceiling. The all-time-record high was 440.4k back in early July 2016.

Whether specs want to chase gold higher or not is irrelevant when their buying firepower is effectively exhausted. I suspect they added more longs over this latest week ending New Year’s Eve, pushing their bets into even-more-extreme territory. That latest data will be out late next Monday afternoon. But with spec longs right up near record highs, additional sizable gold-futures buying to push gold higher is very unlikely.

https://seekingalpha.com/article/4315324-gold-stock-head-fake
 
The Ghosts of 2000

BY SVEN HENRICH ON JANUARY 10, 2020

Finally. A glimmer of cognition. An admission. A sense that the Fed knows, but is largely unwilling to admit it.
But Dallas Fed president Kaplan let it slip, the truth everybody already knows: It’s the Fed’s pumping of its balance sheet that has brought about this party like it’s 1999.

“I do think the growth in the balance sheet is having some impact on the financial markets and on the valuation of risk assets…I want to be cognizant of not adding more fuel that could help create further excesses and imbalances.”

“Some”. Cute. How about all as the correlation has been well established and the Fed is recognized as the only game in town. But at least it’s an admission and a recognition that excesses and imbalances are being created and are already in place.

Last night’s discussion on CNBC Fast Money by all participants shows how pervasive this recognition is, that the Fed is driving everything, it’s not just yours truly that keeps highlighting this point:

https://northmantrader.com/2020/01/10/the-ghosts-of-2000/

IWM continues to show weakness. Day 9 - trouble at the 10 DMA I track it because I trade small and med type stocks.... VXF or the S Fund.

https://stockcharts.com/h-sc/ui?s=IWM&p=D&yr=0&mn=6&dy=0&id=p45444201171&a=712376813
 
IWM - Day 10 below its 10 DMA.... The extremes continue to get more extreme......

https://stockcharts.com/h-sc/ui?s=IWM&p=D&yr=0&mn=6&dy=0&id=p62860066537&a=712376813


SevenSentinels
@SevenSentinels
·
23m
January 12, 2020

Weekly Article- Truth About VIX

https://sevensentinels.com/january-12-2020-mr-vix-delivers-unmistakable-message/

May Not Have Opened Properly On Sunday- but it's here at above link.


Transformative Truth About 2020

https://sevensentinels.com/truth-about-2020/

For the record: I do not use this system for trading. I trade the trend! I just follow his tweets and he posts some free reports/videos on occasion.

The SPY and VXF ( The C fund and the S Fund) continue their march higher. So the trend is up for most since they like to call the market the SPY. However, I track IWM closely and is a vey important indicator in my trading system.

Bottom Line - The trend remains up, but hitting lots of historical extremes.....

We’ve Seen This Before, and It Didn’t End Well
By Jeff Clark
January 13, 2020

The hottest market timing indicator of the past two years has been running cold lately.
https://www.jeffclarktrader.com/
 
Last edited:
LOL..... Yep..... the trend remains up..... IWM back above the 10 DMA, but I use the closing prices for my trend trading system. I'm just watching the show today.

SentimenTrader
@sentimentrader

51m
This "Energizer" rally just keeps rolling, despite extreme sentiment

Click the link below to see the chart hitting extremes....

https://twitter.com/SentimenTrader

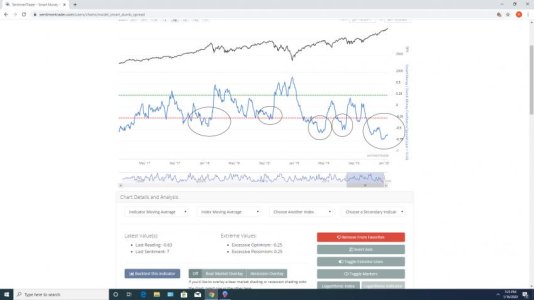
Notice you will see something that looks like a "W" pattern as the market tops on the chart above. (Look at the dumb money/ smart money confidence level spread) Something I have used for years in my trading. Now look at the current pattern since they started "NOT QE" The patterns are clear, and the trend remains up.... The reasons don't matter to me, but the current patter is a result of the Fed in my opinion.... The MT risk level has been at a 8 or a 9 for the longest run ever based on the data for back testing..... Another extreme....
 
Last edited:
A updated comment about the W pattern....


https://twitter.com/SentimenTrader

Notice you will see something that looks like a "W" pattern as the market tops on the chart above. (Look at the dumb money/ smart money confidence level spread) Something I have used for years in my trading. Tom mentions it too.... Now look at the current pattern since they started "NOT QE" The patterns are clear, and the trend remains up, but that is another warning indicator I keep an eye on and track. The reasons don't matter to me why we get the pattern, but the current distorted pattern is a result of the Fed in my opinion.... The MT risk level has been at a 8 or a 9 for the longest run ever based on the data for back testing..... Another extreme....

Bottom Line - The trend remains up with another rare extreme....
 
Don't fight the trend ( I mean the Fed). The trend remains up NO MATTER how many extremes we continue to see. Watching the SOX..... it can be a tell at tops....

https://stockcharts.com/h-sc/ui?s=VXF&p=D&yr=0&mn=6&dy=0&id=p01050684539&a=710071562

My 2 hour trading data....

https://stockcharts.com/h-sc/ui?s=IWM&p=120&yr=0&mn=1&dy=0&id=p43028513026&a=713753062

Bottom Line: The trend remains up, but with many extremes, and we are getting deep into this cycle..... A yearly cycle low is getting closer. It could be a mild one... A BT the 20 month MA or it could BT test the 50 month MA. It doesn't matter to me since I will be trading the daily trend and will be in cash once we move under the the daily MAs. 10 and 20 DMAs..... The yearly cycle low back tested (BT) the 50 month MA during the last YCL. I have know idea how this will play out with the Fed pumping huge amounts of money to it's primary dealers or whomever wants/need 50 billion a day.... The talk is hedge funds can line up too in the days ahead.... I would think many want Trump to stay in office. LOL... Better hope the Senate doesn't lose to many seats if the house remains in control by the Dems..... If that happens it will be four years of grid lock or worse. Lots for investors to think about in the months ahead. Trend traders just don't care...... We trade what is happening not what we think will happen.

Monthly

https://stockcharts.com/h-sc/ui?s=$SPX&p=M&yr=10&mn=0&dy=0&id=p85183521528&a=709838891
 
Last edited:
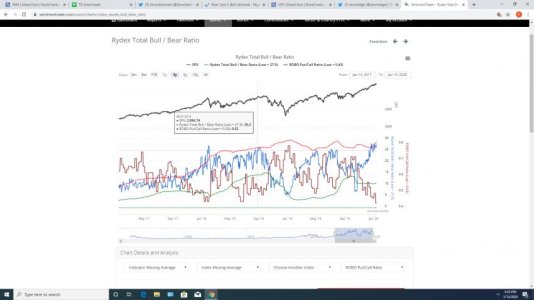
Another extreme - The ROBO/Rydex Total Bull/ Bear Ratio. It now looks like the 2018 January data..... LOL... Nothing for investors to worry about.... Crazy times indeed.....

Chart by Sentiment Trader.

https://sentimentrader.com/blog/

https://twitter.com/SentimenTrader


Tweets & replies Media

SevenSentinels


@SevenSentinels
4h4 hours ago
More
3:10

Market Celebrate P1 Trade Deal w/ Triple Digit Gain As Internals Weaken and VIX Strengthens

https://twitter.com/SevenSentinels?ref_src=twsrc^google|twcamp^serp|twgr^author


Sven Henrich

Verified account

@NorthmanTrader
3h3 hours ago
More
If Newton was a technical analyst today:

"I can chart the motion of markets, but not the madness of people".

https://twitter.com/NorthmanTrader
 

Attachments

  • zroborydex.jpg
    zroborydex.jpg
    44.8 KB · Views: 117
The MACD tool - How to use it, problems with this indicator, and how well it works


SentimenTrader
@sentimentrader

If you're a beginner at trading and want to learn about MACD, here's everything you need to know about this indicator.

How to use it, problems with this indicator, and how well it works

https://twitter.com/SentimenTrader
 
A updated comment about the W pattern....


https://twitter.com/SentimenTrader

Notice you will see something that looks like a "W" pattern as the market tops on the chart above. (Look at the dumb money/ smart money confidence level spread) Something I have used for years in my trading. Tom mentions it too.... Now look at the current pattern since they started "NOT QE" The patterns are clear, and the trend remains up, but that is another warning indicator I keep an eye on and track. The reasons don't matter to me why we get the pattern, but the current distorted pattern is a result of the Fed in my opinion.... The MT risk level has been at a 8 or a 9 for the longest run ever based on the data for back testing..... Another extreme....

Bottom Line - The trend remains up with another rare extreme....

Do you watch patterns? The distorted W pattern is now starting to complete. I will post an updated chart later...

The trend remains up and it looks like the pattern is completing..... I can't wait to see how it plays out! I don't really care what causes these pattern. I just track them and this one has a 100% success rate so far. Will NOT QE change this pattern? So far it has really distorted it, and it's possible it's different this time. With the daily amount of easy money being injected into this market anything is possible. It will just be another extreme for me to watch as the trend remains up!


Have a good one....

Chart by Sentiment Trader:

https://sentimentrader.com/blog/
 

Attachments

  • zwpattern.jpg
    zwpattern.jpg
    38.5 KB · Views: 119
Last edited:
I love those tweets for VST trading..... The trend remains up and the extremes continue to get more extreme.....

SentimenTrader
@sentimentrader

5m
A new record in Trump trumpeting stocks over the past 50 sessions.

Make America Greedy Again.

https://twitter.com/SentimenTrader
 
Back
Top