robo
TSP Legend
- Reaction score
- 471
LOL.... (The Perfect Trade Entry) It is luck when it happens in my opinion.....
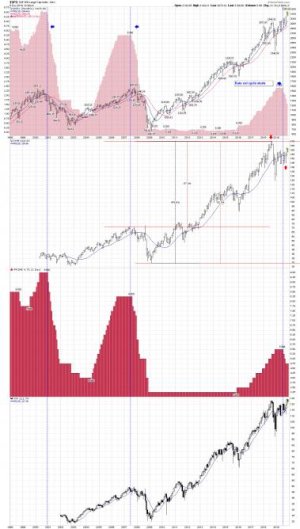
The Perfect Trade Entry
Posted on December 3, 2019
The perfect trade entry for the new intermediate Miner cycle would have been when the Miners formed a weekly swing low during the 3rd week of November. But the Miners did not close above the 10 week MA nor above the declining weekly trend line so in real time we could not be certain that week 28 hosted the ICL.
https://likesmoneycycletrading.wordpress.com/
My trend trading charts....
Daily
https://stockcharts.com/h-sc/ui?s=GDX&p=D&yr=0&mn=8&dy=0&id=p26202691847&a=703319629
Weekly
https://stockcharts.com/h-sc/ui?s=GDX&p=W&yr=3&mn=11&dy=0&id=p06461331105&a=704242674
Gold still hasn't given me a weekly buy signal, but the miners are looking ok. The question is will gold follow the miners? We shall see..... GLD is an important indicator to me, and it remains under its 10 WMA.....
https://stockcharts.com/h-sc/ui?s=$GOLD&p=W&yr=1&mn=10&dy=0&id=p01464617987&a=704242805
I do "NOT" have this service. It's a free report..... I have my own trading system for trading the miners.....
FREE GOLD REPORT - DECEMBER 3, 2019
View this post on GoldPredict.com
If gold continues higher into Friday’s close, then the odds support a 6-month low at $1446.20 on November 12th.
If gold slips back below $1470 in the coming days, then this is likely an early December top, and prices are positioning for one final decline towards the 200-day MA.
As I said, the next few days are crucial. If the market believes Trump about China and the next rounds of tariffs go through on December 15th, then gold will likely continue higher.
If today was just a kneejerk reaction, and Trump walks back his statement, then gold could be topping and break lower one last time before bottoming.
https://goldpredict.com/archives/22415
Last edited: