alevin's account talk


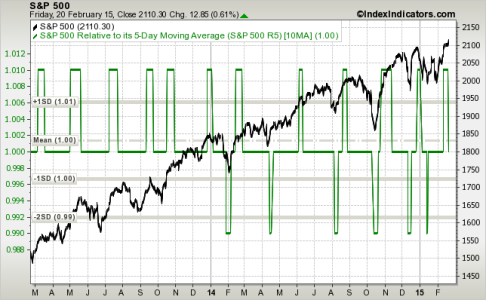
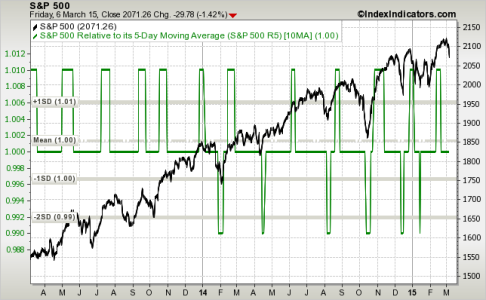
The signal has changed since the last time I posted this chart. Signal has now moved up into the normal sell signal zone up at 1 standard deviation, started last Thursday, I waited for confirmation Friday that the sell signal had started to move sideways. it did. So I thought earlier this weekend that I would move out of C fund as of COB today, but after further reviewing the normal sell signals, it seems to be typical for the signal to come and stay a little while before the market actually tops out, so I decided to stay a little longer.

I'd post a current chart, but you'll have to use your imagination with this older one. for some reason the site where I'm pulling these charts from has been down all day today. Every other site I've tried, still works so it's something with the server for the charting site. Hope the site will be back up and running tomorrow morning so I can see what the signal did today. I may or may not move in the am. It depends. There's hesitation in the chart, and it's a dangerfull market, so I may move just to go to ground and play it on the safer side. will post tomorrow if I actually decide to make a move.
 
figured out the problem with accessing the charting website. My normal puter went to the shop late last week, and I'm operating off my old old XP desktop until the other comes back from the shop. Hadn't used it in quite awhile. Went to upgrade silverlight over the weekend, following update instructions, didn't remove older version first (instructions didn't say I needed to do that, I checked beforehand). Install failed. NOW it said I should have removed the older version first. So I went to uninstall the old version. that was a challenge, took some doing. but the new version is failing to install still, and refuses to uninstall so I can start over. That's why I can't check current status of my chart. Dang it. Only figured it out last night when I went to do some FreeStockCharting, which also requires Silverlight.

Looks like I'll play conservative today and drop my 30%C down to 15% C, 15% F. That way I might get some incremental benefit from staying in longer, or at least minimal damage, until I get one or both puters back up and running with Silverlight, maybe I'll play Squalebear's % game back and forth for rest of the month. This one's going in the shop just as soon as I get the other one back. It has a couple other software issues now besides Silverlight, due to not having been updated in awhile in general due to extended lack of use.

i find that by just clicking ok on any and all popups, nearly every program on the internet works flawlessly. they'll automatically install the software you need on your hardware. some will even say they are located within 8 miles of you and want date now. i'm glad al gore invented the free internet, you never know what you will come across.
 
i find that by just clicking ok on any and all popups, nearly every program on the internet works flawlessly. they'll automatically install the software you need on your hardware. some will even say they are located within 8 miles of you and want date now. i'm glad al gore invented the free internet, you never know what you will come across.

Good god...
I thought I was bad...
 
Good god...
I thought I was bad...

i can prove to you the internet is a lie. i live in a town of 400 folks, 11 miles and 30 miles from the next nearest settlements. there are only 3 single gals out here, but one of them is seeing someone regularly. there is not 168 of them within 8 miles of me. none of them look like that. and not one of them want to 'date' me right now. the internet is a lie.
 
You're telling on yourself, b. :hijacked: It's all about impulse control. Your wandering clicker finger is apparently far more adventurous than mine. :laugh: But of course as long as you are discerning and not believing all you read or see, you'll be ok. I just know it. :D
 
So I checked indicator status on my new chart indicator strategy site. Very cool. New behaviors, variations on what I thought I'd be seeing. Mental calibration continues.

sp500-2y 5-10 ma 2yr 2-21-15.png
This is early warning signal (5 x 10 ma)-drop below the mean = sell signal. The 10 x 20 signal hasn't changed yet. Still going at +1SD -sideways.

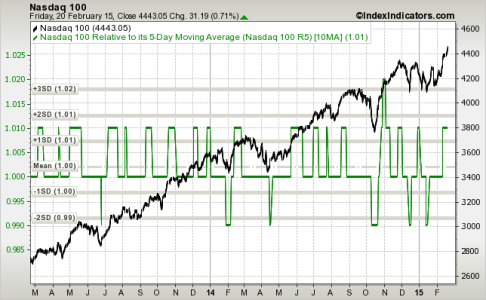
I read somewhere that Nasdaq100 is early warning for spx. So I've been watching that one also, both 5 x 10ma and 10 x 20 ma timeframes. Neither signal has dropped from +1SD-yet. This time the spx 5 x 10 is the early warning system. Hmm. Glad I downshifted my spx allocation when I did, can't wait for next month's signals.

nasdaq100- 2y 5-10ma 2-21-15.png

Maybe I'll choose S next month. or not. depends on whether we get a drop down to the -2SD on one or the other index as good entry spot next month. We shall see. I love my new indicator system. My brain works better with this signal (so far) as a 2-IFT TSP system, than nearly all the others I've experimented with over the past several years. My account returns are already doing better too (so far). I might actually meet my pretty modest goal for the year.
 
Hey batter batter! Swing!

wish I could decide which side to hit the ball from. problem is if I do and miss, it could hurt pretty good.

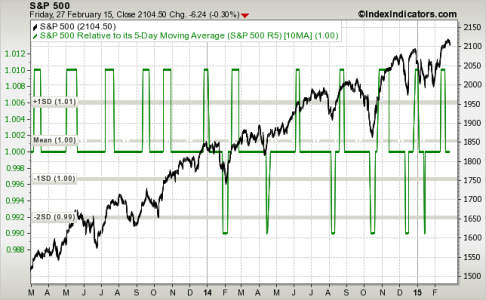
sp500-2y 5-10 ma 2-28-15.png

If I look back at 2013, I'd be bailing right about now, especially if I had more in C than I do at the moment. If I look at behavior in 2014, I'd be letting things ride just a leetle longer, not much, but a leetle. Question is will I see that drop to the 2d deviation, or is this deviant market going to resort back to 2013 pattern where the market never does drop to the 2d dev. Point being, do I stick with the toe I have in the water now and wait for a lower indicator drop, or do I just wait for a measurable drop in the index and look for an indicator move back up to 1SD and/orindex move up to get in while the indicator flatlines a bit longer. decisions decisions.

Guess I'll let this one play out while I get a little sun on my legs, see what else develops signalwise before I jump bigger one way or the other. It was sunny today, but not bikini weather yet by a long shot. Besides, us fair-skinned types don't do well with lengthy exposure to the sun, not without a bit of sunscreen to counterbalance.
 
Think of it this way Alevin...

If every single equity in the S&P500 got taken over by the thugs in Venezuela and simply vanished your account would be cut by 15%. However, my guess is that your bonds would grow because of the panic. What I am saying is that a 100% crash in the C Fund still leaves you 85% whole.

I would not sweat the details. I would be looking for an opportunity to get back in a bit more. Personally, the only thing I am watching is Israel/Iran/Obama Administration. Our Black Swan President could take flight and flub the world...
 
i can prove to you the internet is a lie. i live in a town of 400 folks, 11 miles and 30 miles from the next nearest settlements. there are only 3 single gals out here, but one of them is seeing someone regularly. there is not 168 of them within 8 miles of me. none of them look like that. and not one of them want to 'date' me right now. the internet is a lie.

Good G-D man, I'm married, and I'd still have to move my keester outta there. Those are some pretty stinky odds to play with as a single man. As a fellow voyager, pack up the ark and move along my friend...
 
Good G-D man, I'm married, and I'd still have to move my keester outta there. Those are some pretty stinky odds to play with as a single man. As a fellow voyager, pack up the ark and move along my friend...

well... i may have done a little too much funnin' around in my earlier days so i've been trying to even up the karma balance a bit, also it keeps me out of trouble this way. and as an added bonus, i'm pretty sure i'm the smartest guy in town (but i've thought that everywhere i've lived so there may not be much to that theory).
 
Yeesus Burro, don't mean to intrude, just hope you can get out live it up some and don't become a hermit. "Too much funnin' around in your early days"? c'mon man! seriously. Hope you are not like the guy in the video clip.

 
:eek: What happened to my meek mild-mannered Clark Kent thread? :laugh: Lions, tigers and burros, Oh My!!! or is that Oh. My. GOD! (as Higgins would say :D). Guys, guys-burro can get in trouble no matter where he lives. Don't you know that by now? Conversely, he has the ability to stay out of trouble no matter where he lives, as well. It's called mind over matter (never mind what matter we're talking about, now). The Perils of Pauline, aka Tribulations of the lonesome Burro, could be the subject of a new thread over in the bar, who wants to give it a whirl? any takers?
 
Index indicator update today.

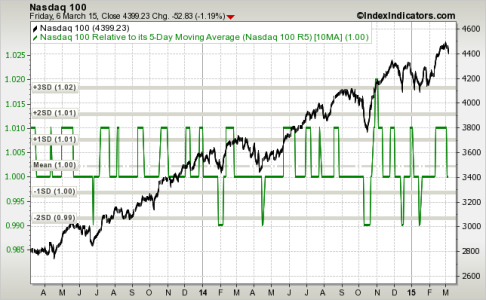
I noticed yesterday that the Nasdaq100 indicator had dropped at long last (must have happened a day earlier, I hadn't noticed), and had already begun almost imperceptibly, to move sideways as of yesterday morning based on 5x10 day mas (smoothed). The Nasdaq itself finally dropped below the mean but hasn't begun moving sideways-yet.

SPX ma indicator still moving sideways below the mean, no further drops-yet. Since I got caught on the drop, I plan on holding for now, until one of the indicators gives me a clearer buy/sell signal. notice that pretty good-sized drops in an index can occur while signal is moving sideways below the mean, even if hasn't dropped to -SD2 or popped back up to the 1SD yet. I'm not looking forward to that, but suspect it will happen before too much longer.

nasdaq100-2y 5-10ma 3-16-1510ma.png

sp500 2y 5-10ma 3-16-15.png
 
I'm curious, when the the Tranny drop?

I wish I knew, Jason. The indexindicators.com site doesn't use the trannies. lots of us market indicators and also overseas market indicators for lots of countries, but not the trannies. :(

I need to check out the internationals and see how they perform against country-specific etfs, tho. haven't gotten to that point yet. the nas and spx are keeping me busy watching every day tho. both the 5x10mas and the 10x20mas.
 
Well, I've gone back through the index indicator charts and compared to $tran and $tranq on stockcharts.

$ndx signal with the 5x10 ma ratio signal was excellent entry point at -2SD, between 1/15-16/15 for $spx and $compq and $ndx. The safer buy signal for $spx at -2SD came a little later on 1/30/15, based on the $spx 10x20 ma ratio signal. the $spx ma ratios did not give buy signal until then.

The $trans and tranq gave confirming/matching signals on those same dates with big red candles followed by sizeable outside or inside green candles (sometimes with springtails, sometimes not), but generally followed by a confirming green candle after the first green candle showed up after the flushing red. If look at the weekly candles, however, the tranq signal on 1/15-16/15 was pretty unsafe to take if planned to stay in the market any length of time. The weekly candle on 1/30/15 was far far safer signal for the $tranq. I'd use that for confirmation for safe longerterm entry on $spx if I were to start using the $trans to confirm ma signals. $tran shows similar, safer weekly candle entry signal on weekly candle at 1/30/15, less safe on 1/15-16.

good to know, even if I don't have the skill to develop my own charting algorithm to do an ma ratio smoothing function for the $tran and $tranq. something else to consider if unsure about entry point.

Agreed, it's always nice to get confirmation from the major indexes, I love it when they are in agreement with each other :)
 
tran and tranq are not real positive going into this next week, tranq showing indecision doji, tran showing red candle close right on the 50 MA.

Likewise, the indexindicator MA charts I'm using these days, are still sitting on the 60 yard line, 1 std dev. below the mean where they have been for days and days. wish they'd either pop or drop down a notch. This buy on a strong signal and wait for next strong signal either way system is still on a learning curve on when/how much/if to act on intermediate signals.

meantime, the prowl for retirement property and related income ideas to offset increased property taxes continues. deeper investigation into the property I was considering has convinced me I need to keep looking around.

learning lots along the way about farm business management for the types of crops I'd be interested in producing. net margin, gross margin, beehives stocking rates for orchards, vegetables, ag property tax deferral laws-different states. I took a class in beef production and animal nutrition way way back, and another that had us working on farm/ranch economics, so not starting completely from scratch. still when talking berries and bees, a lot different than talking beefcows and hay. and it all adds up to water. without it, got nothing. and just like with buying a house, got to have enough cashflow to operate the place and keep it maintained, it's not just about the mortgage payments. keeps my mind interested at least, exploring new ideas.

At this point, my thinking has switched to buying undeveloped, no residence already built. lease or rent for grazing/cropping until I'm ready to retire. have land almost paid off by that point, then decide how much home can afford to build (after selling this place) and still have cashflow to maintain or increase ag operations. looking to buy in more tax-friendly state for retirees as well. this state not one of those.
 
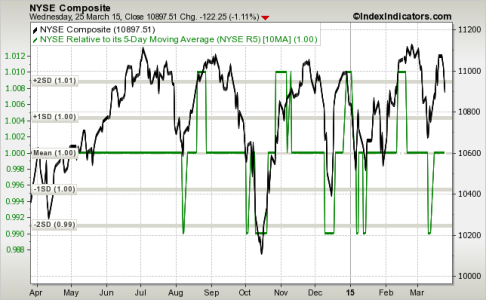
Learning curve ongoing with my new indicator system. Go figure, I thought the indices to watch were sp500 and nasdaq100. Add another to the list. NYSE. The sp500 and nas100 chart indicators have been flat at the midline (mean) since the drop from topping signal in Feb. Wish I'd noticed the NYSE drop to -2dDev earlier this month, much better signal for stepping in, if I'd been willing to wait.

regardless, I'll wait to put the rest of my chips in until I see one of the 3 indices drop to -2SD, whichever drops first will be my next signal for putting any more chips in. My personal trailing stop for bailing is 1%. Will see where today goes. keep losses small, ride the gains. I still have gains at this point.

nyse 1yr 5-10ma 3-26-15.png
 
Back
Top