After a big three day bounce off S&P 1040 (third time too) the S&P is now sitting at 1104.51. The indicators are very overbought. It's now post labor day trading. What can we expect?
Here's how our fellow TSPers are positioned to start the week.
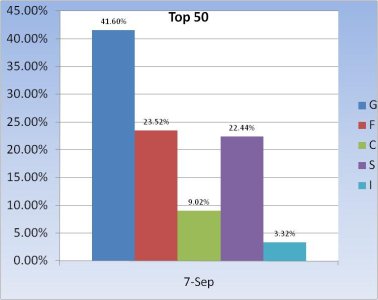
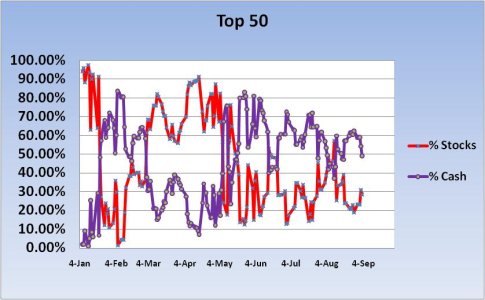
There's one thing that really jumps out at me in the Top 50 charts. The F fund is up big. Real big. And not a lot of stock exposure after that big rally either.
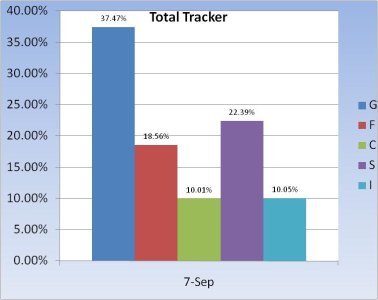
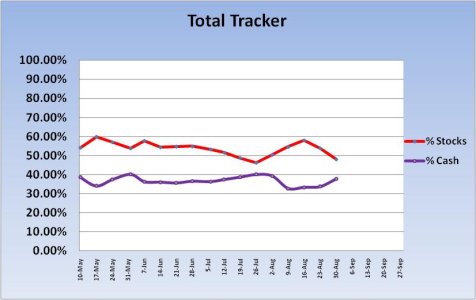
The second chart I could not get to update past 30Aug. I'm not sure why. But the Total Tracker shows that stock exposure has declined to 42.45%. That's almost 6%.
Cash levels only dropped about 0.5%. Guess where that money went? Yep, F fund.
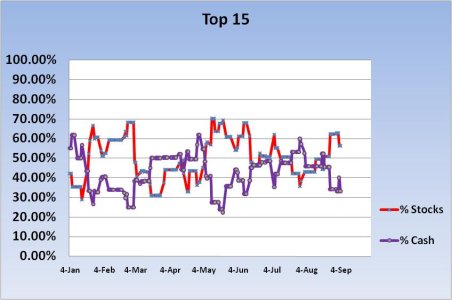
The Top 15 have the lowest collective total invested in the F fund this week. But it's still more than 10%.
Overall, we're getting more bearish as stock exposure has dropped markedly. I'm not particularly bullish and the Sentinels remain on a sell. But it's not just this week that makes me wary. It's the months of September and October combined.
Futures are up modestly, but I'm anticipated some volatile action this week. I'm just going to pull up a chair, grab a bag of popcorn, and watch this from the sidelines.
Here's how our fellow TSPers are positioned to start the week.


There's one thing that really jumps out at me in the Top 50 charts. The F fund is up big. Real big. And not a lot of stock exposure after that big rally either.


The second chart I could not get to update past 30Aug. I'm not sure why. But the Total Tracker shows that stock exposure has declined to 42.45%. That's almost 6%.
Cash levels only dropped about 0.5%. Guess where that money went? Yep, F fund.

The Top 15 have the lowest collective total invested in the F fund this week. But it's still more than 10%.
Overall, we're getting more bearish as stock exposure has dropped markedly. I'm not particularly bullish and the Sentinels remain on a sell. But it's not just this week that makes me wary. It's the months of September and October combined.
Futures are up modestly, but I'm anticipated some volatile action this week. I'm just going to pull up a chair, grab a bag of popcorn, and watch this from the sidelines.
