Here's the updated Tracker charts showing how we're collectively positioned going into the new trading week.
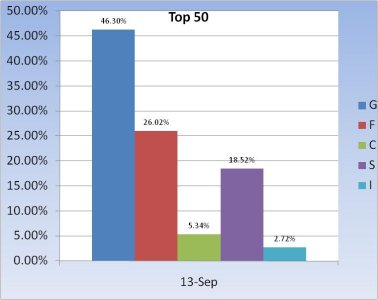
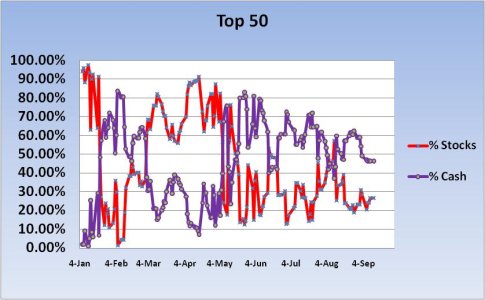
The Top 50 new have about the same level of exposure to stocks that they have to bonds. And with cash levels over 46% that tells me we're not buying this rally or this economy.
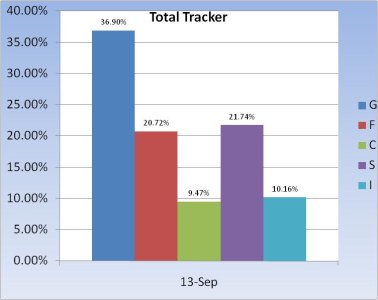
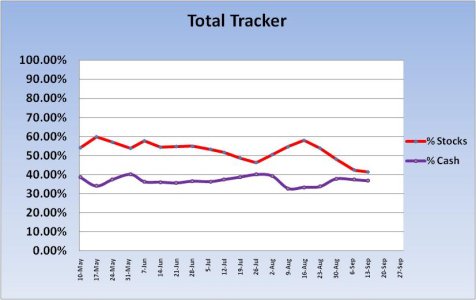
The Total Tracker is similar, although there is more stock exposure and a bit less bond exposure. Still, it's the same message as the Top 50.
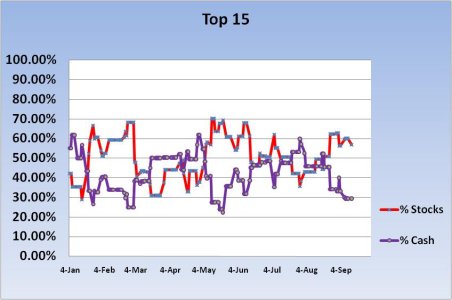
The Top 15 by contrast, are much more bullish, relatively speaking. Their bond exposure is a little under 14% and stock exposure is close to 57%. That's more than double the Top 50.
The average return for the tracker is 0.25%.
The average return for the Top 15 is 1.77%.
The average return for the Top 50 is 10.58%.


The Top 50 new have about the same level of exposure to stocks that they have to bonds. And with cash levels over 46% that tells me we're not buying this rally or this economy.


The Total Tracker is similar, although there is more stock exposure and a bit less bond exposure. Still, it's the same message as the Top 50.

The Top 15 by contrast, are much more bullish, relatively speaking. Their bond exposure is a little under 14% and stock exposure is close to 57%. That's more than double the Top 50.
The average return for the tracker is 0.25%.
The average return for the Top 15 is 1.77%.
The average return for the Top 50 is 10.58%.
