Last week I was intrigued by what the total tracker charts were suggesting, which was an increasingly conservative allocation in the face of buying pressure. This week there's been a bit of change. Let's take a look:
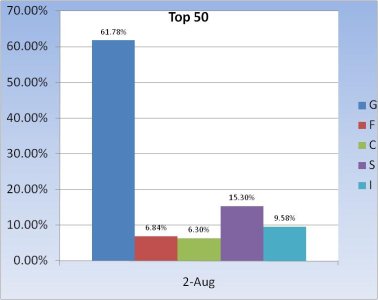
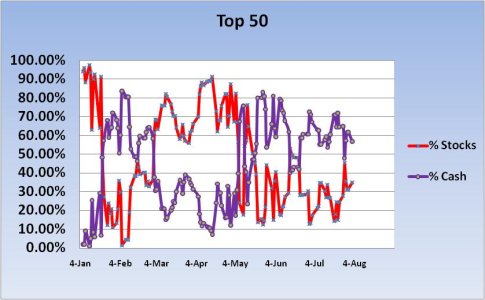
The Top 50 are still showing a conservative allocation overall, but nothing dramatic since last Monday.
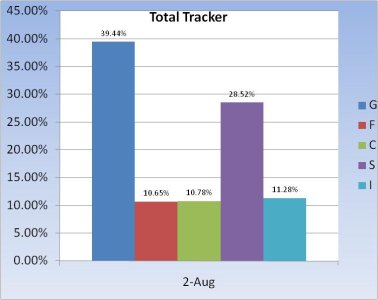
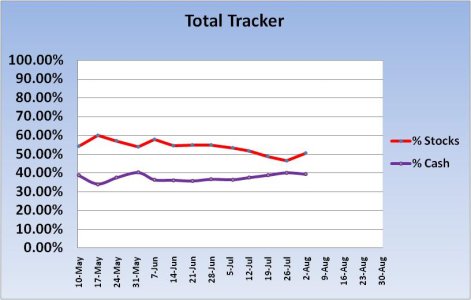
The Total Tracker is showing some buying interest going into the first week of August. But the total cash/stock allocation is still conservative overall and could still be viewed as bullish from a contrarian perspective.
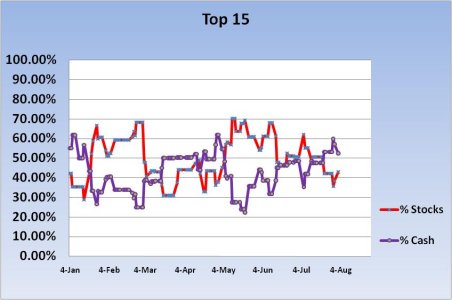
The Top 15 are pretty much where they were last Monday.
So the charts still look bullish to me given the high cash levels. If the Total Tracker cash allocation drops by 10% I'd start to take notice, but for now it suggests higher prices ahead (coupled with a Seven Sentinels buy signal).


The Top 50 are still showing a conservative allocation overall, but nothing dramatic since last Monday.


The Total Tracker is showing some buying interest going into the first week of August. But the total cash/stock allocation is still conservative overall and could still be viewed as bullish from a contrarian perspective.

The Top 15 are pretty much where they were last Monday.
So the charts still look bullish to me given the high cash levels. If the Total Tracker cash allocation drops by 10% I'd start to take notice, but for now it suggests higher prices ahead (coupled with a Seven Sentinels buy signal).
