I have updated the Top 15 and Top 50 charts.


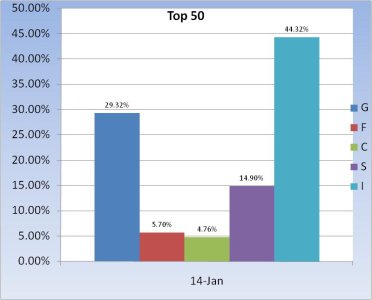
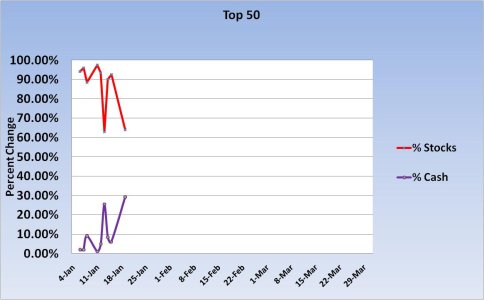
As expected, our Top 50 charts are reflecting the recent market volatility. It is difficult to read too much into these as we have limited data plugged into them, but that should change over time. For the moment though, cash levels have risen as stock exposure has dropped.


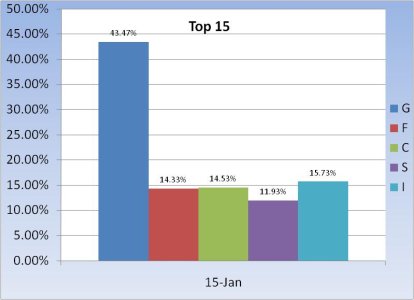
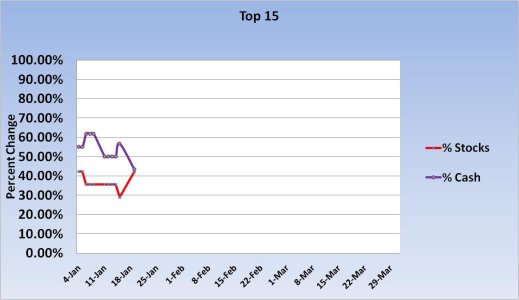
Our Top 15 pushed some cash into equities on Friday in anticipation of buying low and selling high. Only 2 participants did so however. But looking at the fund distribution we can see it's split pretty evenly between cash and stocks. Even the F fund is finding favor with this group.
I am looking for increased stock exposure from this group within the next 1-2 weeks. Could even be a matter of days depending on how the market trades early on next week.


As expected, our Top 50 charts are reflecting the recent market volatility. It is difficult to read too much into these as we have limited data plugged into them, but that should change over time. For the moment though, cash levels have risen as stock exposure has dropped.


Our Top 15 pushed some cash into equities on Friday in anticipation of buying low and selling high. Only 2 participants did so however. But looking at the fund distribution we can see it's split pretty evenly between cash and stocks. Even the F fund is finding favor with this group.
I am looking for increased stock exposure from this group within the next 1-2 weeks. Could even be a matter of days depending on how the market trades early on next week.
