Uptrend's Account Talk

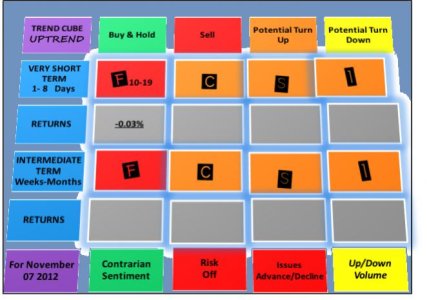
Now that the election is over, the market is lining up for a buy. Big jump on bonds this AM, but no volume. For equities, up/down volume is up and in the buy zone, despite this flush-out. A short term and intermediate term buy are shaping up, as soon as "Risk On" cooperates. This time short term and intermediate term buys may trigger almost together, and this may happen as soon as tomorrow or in the next few sessions. There is good support at SPX 1389-1398, which in my view needs to be tested. The US dollar is getting toppy short term.
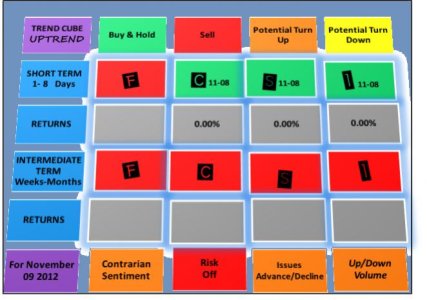
cube_11_07_12.jpg
 
A short term buy signal appeared yesterday for C, S I (as I posted). We are nearing an intermediate term turn as well, that is not too far away. To drive higher, we must see sentiment turn more negative (hence contrarian sentiment would turn positive), and although it was negative for a few days it was a little positive at the close yesterday. Also "Risk" is off, and will be off until the rebound takes hold. The market has now retraced 50% the distance from the SPX 1475 high in September to the 1267 low back in June. This looks about right for a primary wave four retracement, with wave five ahead. There could be fits and turns and a few false starts. So, I ventured 50% on the table yesterday (25%C and 25% S), holding the other half out, until the bottom is put in. Europe is having problems, but the US dollar is toppy and should turn down soon, which may be a catalyst for a rally. For example UUP (US dollar bullish index fund) has two daily candles that are black and todays is black so far (which means the market opens up and then reverses intra-day and closes below the open). When you see three in a row the probability increases that the advance is losing steam.

cube_11_09_12.jpg
 
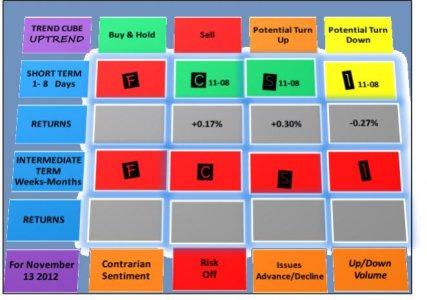
On todays cube the short term trade is struggling, but still in play. There are a number of postive divergences on the 60 minute charts, and negative divergences on the bonds and US dollar charts. Risk remains off, and contrarian sentiment is not as bearish as it should be to get an advance, but moving in that direction. Looks to me like a tug of war market. The I fund can't get going, and this is related to the US dollar advance and the weakness in Europe. There is a possible reversal cande on the US Dollar Bullish Index fund (UUP) this AM that is a black breakaway candle. Let's see if it takes hold and gets the market going.

cube_11_13_2012.jpg
 
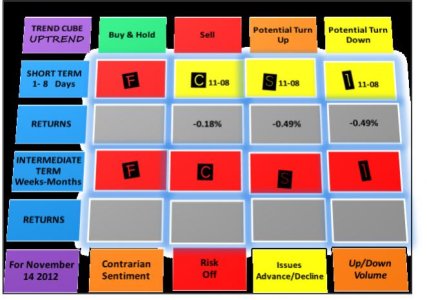
Mr market has a mind of its own and can't seem to get going. The cube short term trade is at risk of a failed trade, as internals are turning against it. However, up volume is still greater than down volume believe it or not. On one hand it appears it could be bottoming and testing SPX 1372 area and the longer term trend line, or bad expectations moving forward, fiscal cliff, options X manipulation; you name it. Moving towards bearish sentiment, but pretty much nuetral. US dollar is slowly losing steam, so a rally in equities could be around the corner.

cube_11_14_12.jpg
 
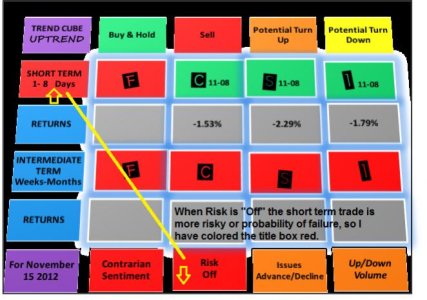
After the market blew through the 200 ema on SPX yesterday, down she went. Not sure what to expect today. On the cube, when "Risk On/Risk Off" is in the "Risk Off" condition the short term trade has a higher probability of failure, as you might expect. Therefore, I have painted the title box red for the short term trade, while the equities are green. The market is now oversold again on a short term basis. At last check this AM the US dollar bullish index (UUP) is trading down and bonds are trading down. If these relationships continue to hold, the market could rally at any time although options X week might subdue it. It's hard to say. Also sentiment is just not bearish enough and this may be causing problems with the market wanting to rally from a contrarian viewpoint.

cube_11_15_12.jpg
 
The US dollar index fund UUP, has a breakaway gap up this morning. The US dollar is now starting to get overbought in the short term. Bonds are trading sideways and the internals are losing steam. The equities markets are now extremely oversold. SPX is retesting the 0.618 fibonacci level from June to September. The math: 1475-1267 = 208 // 208*0.618 = 129 // 1475-129 = 1346. The low this morning 1344.98, which puts it right in the pivot range. If the market does not recover here and drops below 1340, we will have a different kind of market: a bear. However, there is quite of bit of volume buying that has bneen going on, on the way down, and at this resistance level. this may be a good entry point to scale into the market if you are out, and if you like risk.

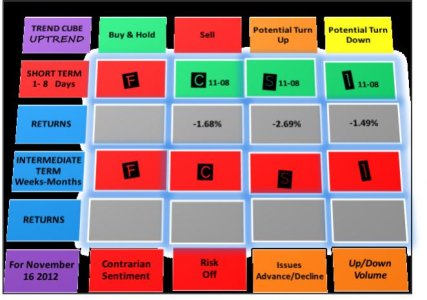
cube_11_16_12.jpg
 
Big change on the cube. Risk is now "Risk On" and I will be tracking the 3 funds (C,S,I) as well as the short and intermediate term trades. I believe that "Risk On" will be very tradable. The short term trade bought at the wrong entry point (11/08), but the gains will correct over the next several sessions, but lower that what would have been possible. Bonds are a sell, and the US dollar is correcting down. The intermediate term trade is not far from triggering, if the rebound continues. At the moment, the I fund is the strongest. SPX 1390-1400 zone offers significant resistance, and this must be cleared for a longer term advance. One scenario would be to test this area and fail the first go-around, go back and test the lows or a higher low, and then another assult. Another scenario would be to clear now, and never look back.

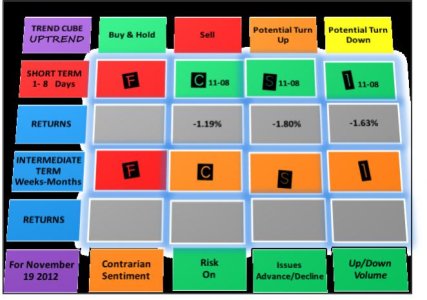
cube_11_19_12.jpg
 
Todays cube. I expect the US dollar to keep trading down, and if the UUP MACD breaks the zero line as I expect, we shall see a further surge in equities. We should see green for C, S and I before days end. Bonds are trading down. I am now tracking the gains/losses from Risk On/Off on the cube

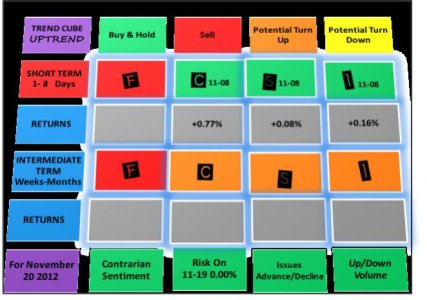
cube_11_20_2012.jpg
 
Market is stalling this AM. Sentiment is getting too bullish. Light volume should pick up the market as the day goes along, but it is at the fail danger zone. Risk is flirting with failure. Internals don't look that hot, but could go either way. SPX 1390 significant resistance ahead. The US dollar is starting to turn up, and this should be bad for equities.

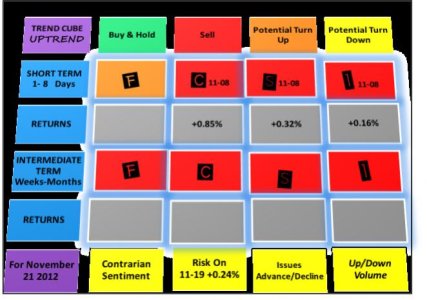
Cube's short term trade is over. C,S, & I were in the market 8 trading days on a roller coaster ride. Because C did the best, may tell that institutional folks are not sure and hedging towards large cap safe companies. The final tally for the short term trade will be at close of trading today. Bailed to 100% G today. For this last trade, I used a strategy where I bought in 50% on 11/8 and 50% on 11/16, so did considerably better than what is shown above. There were twin momentum lows over a few days spread, with a lower price low. Happy Thanksgiving!

cube_11_21_12.jpg
 
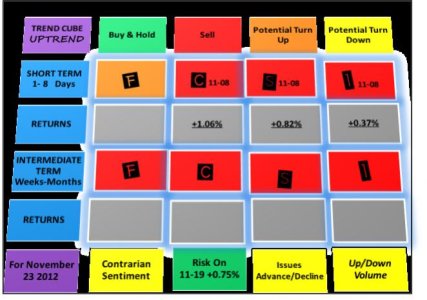
Cube for Friday. Note that the short term trade is over, and the underlined returns are the results. The trade started on 11/08 and sold on 11/21. You will also note that I am tracking "Risk On", currently at +0.75%. Because of cube constraints, I am showing the returns for the S fund only here.

Futures show the market up again for Friday. Bullish sentiment is at an extreme level, so this may bring the market down. Better than 50% chance that this is an oversold bounce in an ongoing downtrend. So far we have a SPX +0.36 bounce from the decline (1475-1343), ande 0.382 would be near SPX 1393. A testing of this level is very do-able Friday, and then possibilities including: a drop back to the lows or a lower low, drop but to a higher low, or keep on going up. The weekly charts indicate that a multi-month rally may commence in the not to distant future. Do I believe it?- No, but if too many think that way we will have a rally. Investing is such a ficke business, as it follows the fear and greed cycle.

cube_11_23_12.jpg
 
This is the date last year, when the equities market hit it's low and then took off. The upswing came 5 days earlier this year. Today the market is overbought and is cooling off. How much cool is the question. Because the SPX 1390-1400 area was passed, it is now support. On the other hand there is pretty good resistance between 1413 and 1422. So I am wondering if there will be much of anything this week, other than a narrow trading range.

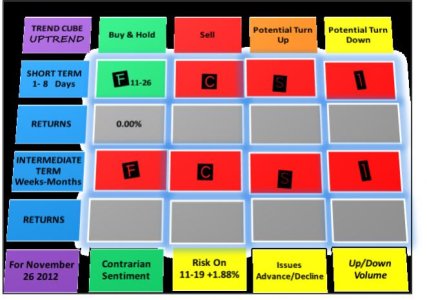
The "Risk On" indicator and trade I added (S fund only) has a yellow tag. This means that there is a risk of failure, but that it is uncertian at this time. It also means that the metrics under the indicator are stretched.

cube_11_26_12.jpg
 
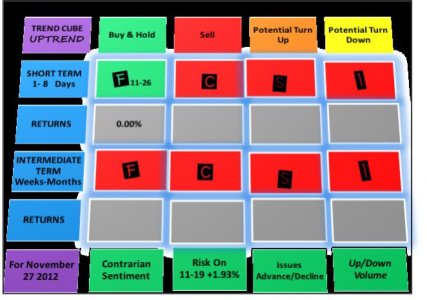
Even though the market is still overbought to some degree, the sentiment is way too bearish which is driving prices higher. However, the US dollar is looking like it wants to tick up as well as bonds. If you are on the sidelines, IMO that is good, because this is no market to enter until the direction is determined. Institutions were buying quite a bit of SPY yesterday, so I guess they believe that prices will stay up for a while. The "Risk On" indicator trade continues to rack up gains.

cube_11_27_12.jpg
 
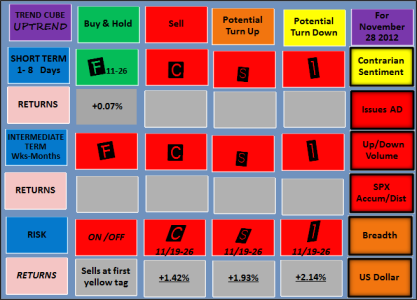
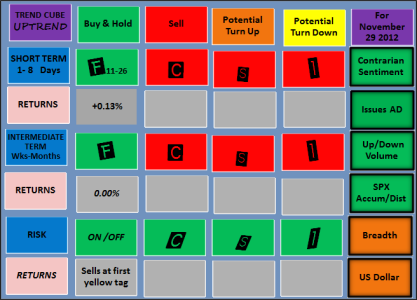
I made some changes on the cube. Let me explain. A Risk trade has been added so now there are three trades: 1) Short term 1-8 days, 2) Intermediate term, days-weeks, and 3) Risk On/OFF, length variable. When Risk goes green, it's a buy and it sells at the first yellow tag. The reason for this is to protect the gains, when indicators suggest that the Risk is changing to more of a Risk Off condition.

The cube is meant to be read across, except for the very right column, where certian market factors are shown. These boxes are outlined with black to make them stand out. Three new boxes have been added: 1) SPX Accumulation/Distribution. This metric gives one a sense of overall market buying or selling, 2) Breadth. This gives a picture of market behavior. Breadth generally leads price, and 3) US Dollar. The US Dollar is important to track, because it usually goes inverse to equities.

Today the new downtrend is just getting started. I think the SPX 1390 support area will break. The US dollar is turning up from oversold. Breadth says that this downtrend may be short lived, but we shall see.

cube_11_28_12.png
 
I am posting early, due to a busy schedule tomorrow. Sure a knee jerk reaction today to Speaker John Boehner's comments. One 30 minute candle on the SPX emini futures move 9 points in 30 minutes or 0.65%. I bet some 3X shorts got burned royal. Risk went Off and is now back On all in the same day. Go figure.

I have overlooked something on the cube, and for that I apologize. The F Intermediate term trade has been On (green) for quite a while. I have been so focused on the equities and short term trade, I overlooked it. Anyway it is still on, but shows some signs of weakening. It is overbought, and rate of change has been declining.

Market breadth is still improving. We could be in for a rally, but could pull back first at any time. Bearish sentiment keeps driving it forward.

cube_11_29_12.png
 
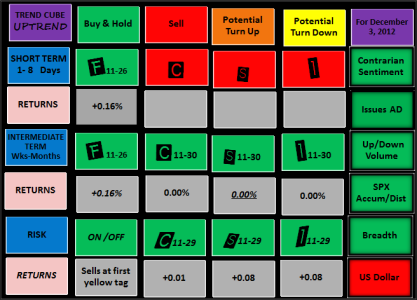
You will note on the cube today the intermediate term trend flipped to a buy, but the short term is still on a sell. This can happen when the cycles are out of phase. I am planning to enter, as soon as the short term gets oversold, which is not now. Perhaps later this week? The risk on trade is proceeding. Bonds are still kind of holding up, but I expect the short term to sell, as soon as equities get going. Many market indicators are now pointing up in the intermediate time frame. IMO, one more down fake to SPX 1396-1400 and then up to 1440.
cube_Dec_2012.png
 
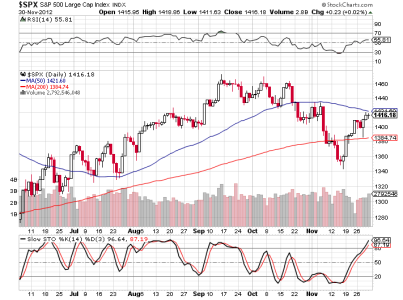
Uptrend...total newbie here but trying to understand your comment about short term being oversold which is now. What indicators are you watching to come to that conclusion? The RSI on SPX is at roughly 55 and trending higher and the STO is well above the 80 threshold. Wouldnt this be considered overbought conditions (or at least trending towards overbought given the RSI)? Am I misinterpreting this chart?


Screen Shot 2012-12-03 at 6.41.08 AM.png
 
Gronk, you are correct in that the market is currently overbought. I believe you misread Uptrend's analysis. He said he was gonna wait for the market to become oversold before getting in. I'm also waiting to throw some more money into a pullback.

Edit: Which is Not now, lol.
 
Bmneveu...I guess I didn't read that since he said his entry point might be later this week. I don't think we are going to swing from overbought to oversold conditions in a couple of days...note I am not hammering the commentary I am just trying to make sure my novice TA understanding isn't way off base.
 
Bmneveu...I guess I didn't read that since he said his entry point might be later this week. I don't think we are going to swing from overbought to oversold conditions in a couple of days...note I am not hammering the commentary I am just trying to make sure my novice TA understanding isn't way off base.

When the short term is on a sell (red on the cube) the short term timeframe is over bought. It needs to cool and come down towards nuetral or more towards oversold; which is not now. I was guessing that better entry conditons would be later this week. The reason that the intermediate term trend is on a buy, is because market fundamentals have improved. The cycles will probably get lined up in a few days. This difference in timeframes and market activity is normal.

Bonds, especially short term bonds, took a huge drop this AM. Not sure why. So the short term F sells today 12/03
 
Back
Top