-
The Forum works well on MOBILE devices without an app: Just go to: https://forum.tsptalk.com
-
Please read our AutoTracker policy on the IFT deadline and remaining active. Thanks!
-
$ - Premium Service Content (Info) | AutoTracker Monthly Winners | Is Gmail et al, Blocking Our emails?
Find us on: Facebook & X | Posting Copyrighted Material
-
Join the TSP Talk AutoTracker: How to Get Started | Login | Main AutoTracker Page
You are using an out of date browser. It may not display this or other websites correctly.
You should upgrade or use an alternative browser.
You should upgrade or use an alternative browser.
tsptalk's Market Talk
- Thread starter tsptalk
- Start date
James48843
TSP Talk Royalty
- Reaction score
- 906
Scratching my head. I don’t think the markets are thinking about tariffs in April. Those are going to be real, and painful, and stocks will have to recognize that.
- Reaction score
- 2,459
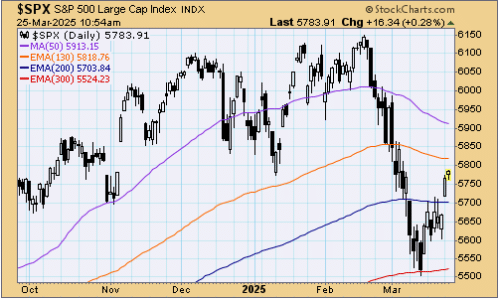
We're seeing some decent follow through action for a market that was chopping back and forth last week and couldn't hold a gain. The draw of Monday's gap open should be there, but the FOMO underinvested tend to buy the dips and keep them shallow if they think they've missed the boat.
Don't forget the rebound was due, but the rally could run out of steam and start a new leg again at any time (later today, next month, etc.) . We saw plenty of large rallies during the 2022 bear while the market trended lower.
We may have put in a low, maybe not, but now it's a matter of watching how the indices handle various level of overhead resistance, and how the market handles bad news. Does it collapse or hold steady, etc.?

Last edited:
- Reaction score
- 2,459
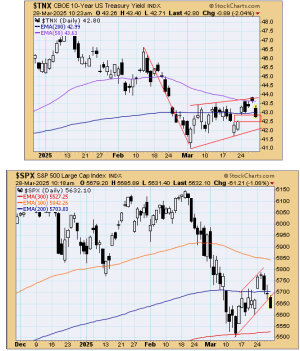
Stocks are pulling back after the 3-day rally. Some strong Durable Goods data is sending yields up, but once again the 10-year is banging its head again the top of that bear flag and the 50-day average, which typically would be a bearish formation for yields.
The S&P 500 and small caps are down on the day with the recently hot again tech stocks lagging today.
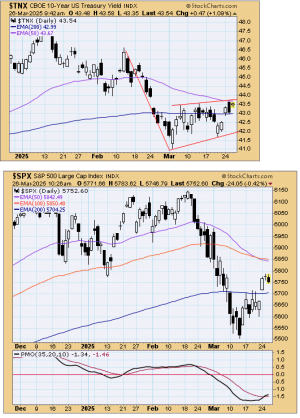
There is an open gap near 5660 but the 200-day EMA would be tested as support first near 5704. The question is whether this is a pause in the relief rally -- or a peak?
Inflation data on Friday, and the April 2 tariffs loom as the market digests those recent gains.
The S&P 500 and small caps are down on the day with the recently hot again tech stocks lagging today.

There is an open gap near 5660 but the 200-day EMA would be tested as support first near 5704. The question is whether this is a pause in the relief rally -- or a peak?
Inflation data on Friday, and the April 2 tariffs loom as the market digests those recent gains.
- Reaction score
- 2,459
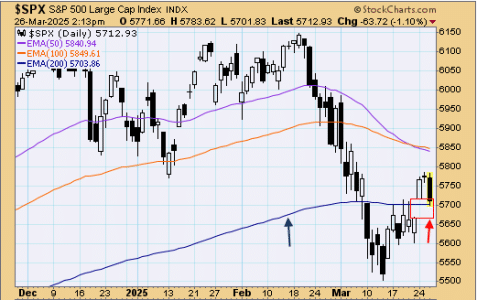
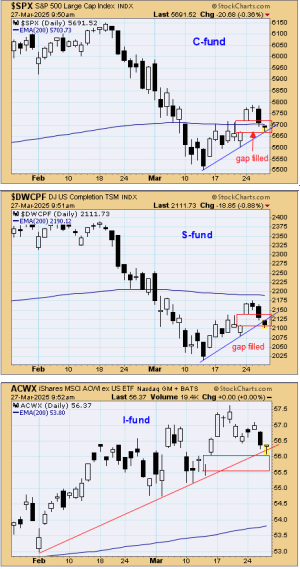
We have a nice little reversal here as the indices tested the bottom of their open gaps (see prior post) and so far have been successful in holding.
The new auto tariffs have been causing some concern this morning. You can see what's happening to a stock like Ford, for example. It made new highs at one point this morning, but now it has made an outside day pattern. Where this closes will be telling as it will show us if it will be a positive or negative outside day, and right now it looks like it could go either way. Below 10 would be bad, above 10.30 would actually be pretty bullish. Outside reversals can be direction changers if they go against the trend.

Ford isn't a major factor for the stock market in general but it will give us an idea of the effects of the tariffs on business as they get implemented on various industries.
The new auto tariffs have been causing some concern this morning. You can see what's happening to a stock like Ford, for example. It made new highs at one point this morning, but now it has made an outside day pattern. Where this closes will be telling as it will show us if it will be a positive or negative outside day, and right now it looks like it could go either way. Below 10 would be bad, above 10.30 would actually be pretty bullish. Outside reversals can be direction changers if they go against the trend.

Ford isn't a major factor for the stock market in general but it will give us an idea of the effects of the tariffs on business as they get implemented on various industries.
- Reaction score
- 2,459
The PCE Prices inflation data came in higher than expected, or did it? The numbers were in fact higher than estimates but instead of rallying, bond yields are falling sharply as if the data was soft, helping the F-fund to a nice gain this morning.
However, that isn't helping the stock market which doesn't seem to like the numbers and the buy the dip crew is sitting on their hands this morning allowing the SP 500 to make a move toward a test of the prior lows.
At this point it becomes technical as those who may have sold the lows earlier this month might get an opportunity to buy back in at those prices (this is why double bottoms often hold), but if the S&P makes a new low it could cause a "get me out at any price" mentality and that's where you often get capitulation (I give up) selling, which can be ugly, but the selling eventually exhausts itself and snaps back. Either that or the correction will start to morph into a bear market.
Right now there's only a 16% chance of an interest rate cut at the May FOMC meeting, but a 95% chance of at least one cut at or before the September meeting.
However, that isn't helping the stock market which doesn't seem to like the numbers and the buy the dip crew is sitting on their hands this morning allowing the SP 500 to make a move toward a test of the prior lows.

At this point it becomes technical as those who may have sold the lows earlier this month might get an opportunity to buy back in at those prices (this is why double bottoms often hold), but if the S&P makes a new low it could cause a "get me out at any price" mentality and that's where you often get capitulation (I give up) selling, which can be ugly, but the selling eventually exhausts itself and snaps back. Either that or the correction will start to morph into a bear market.
Right now there's only a 16% chance of an interest rate cut at the May FOMC meeting, but a 95% chance of at least one cut at or before the September meeting.
- Reaction score
- 2,459
The test of the lows is upon us, but so far it has been bouncing back. It doesn't feel like a capitulation yet, but to be honest I was working on a technical issue at the lows of the morning and I may have missed any panicky action that would cause a low.
The S&P 500 (C-fund) is trying to bounce back and hold that key moving average that held on the prior low. The opening gaps are closing and if and when they do close, the bears may give it another shot.
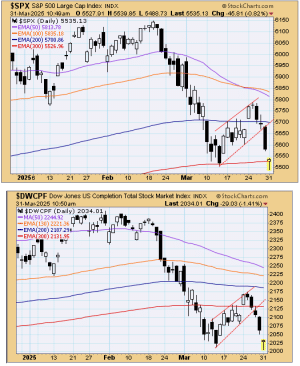
The bounce back may have started too early so it probably means one of two things with little in between. One is that the rally fails and we head toward the lows again by the close. Two, that was a capitulation near the open and the we close near the highs of the day with a bottom possibly completed. With emotions so high, it probably won't be just a run of the mill down day - but rather one of those two scenarios.
Oil, Gold, and bitcoin are all up this morning, as are bonds as yields are down again, and the 10-year Treasury Yield is testing the bottom of its bear flag.
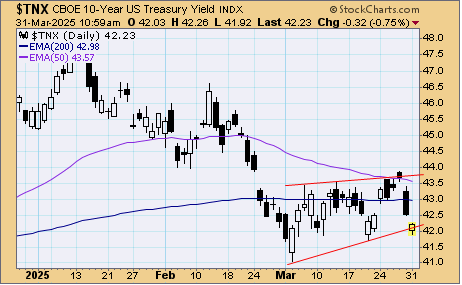
The S&P 500 (C-fund) is trying to bounce back and hold that key moving average that held on the prior low. The opening gaps are closing and if and when they do close, the bears may give it another shot.

The bounce back may have started too early so it probably means one of two things with little in between. One is that the rally fails and we head toward the lows again by the close. Two, that was a capitulation near the open and the we close near the highs of the day with a bottom possibly completed. With emotions so high, it probably won't be just a run of the mill down day - but rather one of those two scenarios.
Oil, Gold, and bitcoin are all up this morning, as are bonds as yields are down again, and the 10-year Treasury Yield is testing the bottom of its bear flag.

Last edited:
FAAM
TSP Strategist
- Reaction score
- 117
Hmmm, nearing the close today, the 'next' day, & the market results look a bit undecided.... like our tank is in 'neutral-steer', spinning in circles a bit. I put off decision to submit an IFT to wade in off the lily-pad until tomorrow morning, as did my wife who held off on her IFT to pull her 50% C-fund position back to G... until tomorrow morn.At end of day results, I vote for your #2 option and hope it sticks.
- Reaction score
- 2,459
More choppy action to start the day as the world braces for today's highly anticipated tariff day. Stocks and yields are flat at the moment, after opening lower. This looks like a key pivot point for the stock market.
Take the S-fund chart: We have a bullish double bottom look that may or may not be morphing into a bearish head and shoulders pattern, which would tend to break down in a negatively trending market.
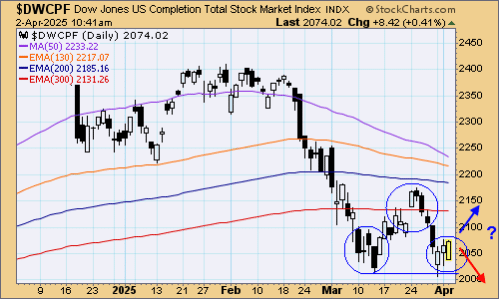
The 10-year yield is looking to stabilize at the prior lower after breaking down from a bear flag earlier this week. The F-fund goes up when yields come down.
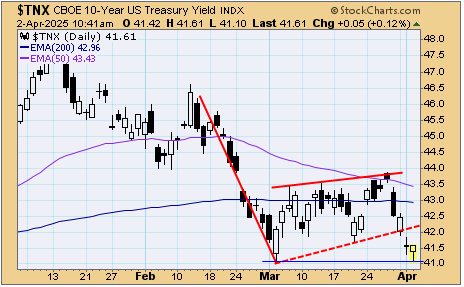
These are not the best looking charts, but they're not dead as long as the prior lows keep holding.
Take the S-fund chart: We have a bullish double bottom look that may or may not be morphing into a bearish head and shoulders pattern, which would tend to break down in a negatively trending market.

The 10-year yield is looking to stabilize at the prior lower after breaking down from a bear flag earlier this week. The F-fund goes up when yields come down.

These are not the best looking charts, but they're not dead as long as the prior lows keep holding.
Last edited:
- Reaction score
- 2,459
OK, so we had the bear flags developing and break down a few days ago and the "V" bottom story was erased, and that was followed by a test of the bottom of that flag as the S&P 500 ran up to a wall of resistance yesterday. Today is the day that failed and rolled over.
One day losses like this are tough to swallow, unless you were raising some cash or buying bonds in recent days. Yes, it could have gone another way but this chart was trying to tell us something when it broke.
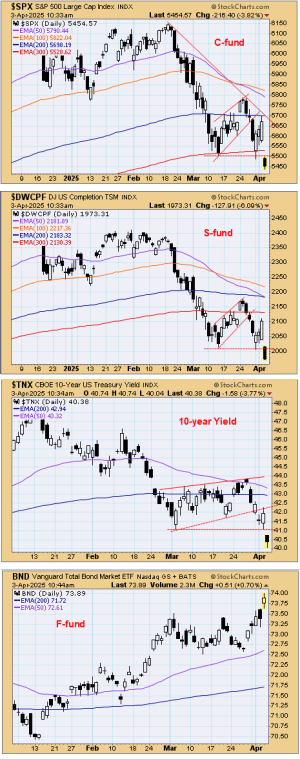
The initial bear flag break down target in the S&P 500 is still another 100+ points lower but we know that Trump or the Fed could step in at any minute and change everything, so it's not something that might happen overnight. It could take hours or weeks to hit that target, or like I said, it could be thwarted. I'm looking more at longer term charts for clues right now.
The S&P is still "just" 11% off the all-time highs and as I've said before, 10% declines occur about once per year on average. The questions is which 10% declines become 20% declines?
One day losses like this are tough to swallow, unless you were raising some cash or buying bonds in recent days. Yes, it could have gone another way but this chart was trying to tell us something when it broke.

The initial bear flag break down target in the S&P 500 is still another 100+ points lower but we know that Trump or the Fed could step in at any minute and change everything, so it's not something that might happen overnight. It could take hours or weeks to hit that target, or like I said, it could be thwarted. I'm looking more at longer term charts for clues right now.
The S&P is still "just" 11% off the all-time highs and as I've said before, 10% declines occur about once per year on average. The questions is which 10% declines become 20% declines?
Last edited:
- Reaction score
- 2,459
The selling continues and the charts are breaking down furiously - crash-like now.
The jobs report came in awkwardly strong while the rest of the market is bracing for a possible recession.
These waterfall like declines don't usually create "V" bottoms without Fed intervention or some other change in policies, but snap back rallies will be big when they come. Be careful. It will move fast in both directions in the coming trading days.

Meanwhile investors are not only running to bonds for safety, but because the economy is in question and when the economy weakens, yields go down and bond prices go up.
The jobs report came in awkwardly strong while the rest of the market is bracing for a possible recession.
Nonfarm payrolls expanded by 228,000 last month, while economists polled by Dow Jones forecast an increase of 140,000. The unemployment rate inched up to 4.2%, https://www.cnbc.com/2025/04/03/stock-market-today-live-updates.html
These waterfall like declines don't usually create "V" bottoms without Fed intervention or some other change in policies, but snap back rallies will be big when they come. Be careful. It will move fast in both directions in the coming trading days.

Meanwhile investors are not only running to bonds for safety, but because the economy is in question and when the economy weakens, yields go down and bond prices go up.
- Reaction score
- 2,459
We are not allowed to give advice. People here are usually just telling us what they're doing. I tell TSP Talk Plus subscribers what I'm doing, but it's not advice. It's just what is right for me in my situation. Maybe it helps others make a decision for their situation, but a 25 year old and a 65 year old probably have different approaches.
Similar threads
- Replies
- 0
- Views
- 35
- Replies
- 0
- Views
- 172
- Replies
- 0
- Views
- 87
- Replies
- 0
- Views
- 152
- Replies
- 0
- Views
- 119

