After updating the Top 15 and 50 charts today I noticed a significant shift in both groups, which may be suggesting it's time to get defensive.
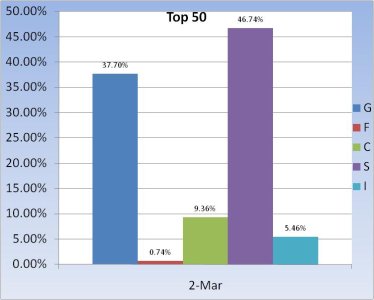
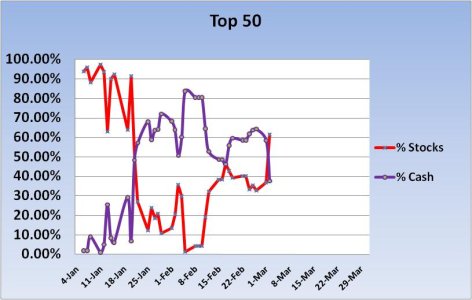
First the Top 50:


Stock levels decidedly up, cash levels down. This is a picture of what's working from past to present and not necessarily what will work moving forward. It is not particularly telling in and of itself and should come as no surprise that some of our more aggressive tracker folks are moving up the list given recent gains.


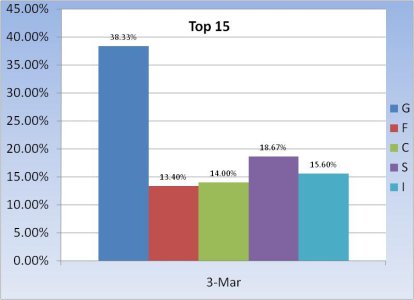
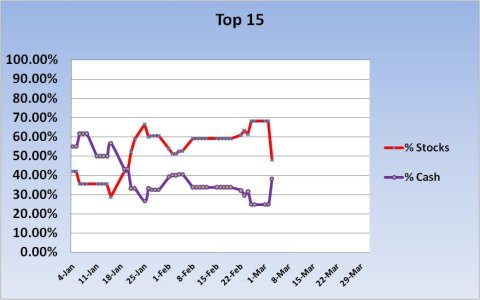
The Top 15 on the other hand is showing the opposite action. Stocks down, cash up. This group is made up of active traders who've proven they have some measure of market savvy based on two years of tracker performance. Today's shift was large enough to demand at least some consideration of getting defensive.
This is my second blog for today, so if you haven't seen my daily Seven Sentinel comments yet, make sure you find that post and get today's read. See you tomorrow.
First the Top 50:


Stock levels decidedly up, cash levels down. This is a picture of what's working from past to present and not necessarily what will work moving forward. It is not particularly telling in and of itself and should come as no surprise that some of our more aggressive tracker folks are moving up the list given recent gains.


The Top 15 on the other hand is showing the opposite action. Stocks down, cash up. This group is made up of active traders who've proven they have some measure of market savvy based on two years of tracker performance. Today's shift was large enough to demand at least some consideration of getting defensive.
This is my second blog for today, so if you haven't seen my daily Seven Sentinel comments yet, make sure you find that post and get today's read. See you tomorrow.
