Wasn’t that a great rally last week of 3-4%? One would think that the downtrend is over. To find out, I smoothed candlestick price charts with a five period exponential moving average (ema) in the daily timeframe, and made price invisible. Eight, charts representing the C, S, I and F funds are shown, as well as the US Dollar, Euro, German DAX and Spain’s IBEX. Because of upload limations, Spains IBEX, the US Dollar (USD) and the Euro are shown on a second blog entry.
After looking at all of these charts, I do not see a reversal in trend, yet. For a reversal to occur after a low, we must see a higher high taking out the previous high. A higher low then needs to follow. It just isn’t there. Rather last week’s rally appears to have been working off an extremely oversold condition. Further, the US Dollar (USD) and Euro charts suggest more trouble ahead for equities, as their respective trends show little signs of being finished.
Data to support the bull’s case include: 1) a great start off of support for US equities, 2) some positive divergences; i.e. higher low on RSI while the market was still falling, 3) fairly bearish sentiment, 4) some kind of Europe bailout surprise may unfold, and 4) the primary trend is still up for US equities from the March 2009 low, even though the intermediate trend is down. Data to support the bears case include: 1) no higher high and higher low is in place; either on daily price point extremes or by smoothed moving averages, 2) no high volume washout supporting the notion of a low on most charts (other than EFA), 3) no bottoming process with back and forth price action and high volatility like we saw in August/September, 2011, 4) monthly RSI on SPX and Dow Jones has been carving out a divergence for the last 14 months (price chart made a higher high, while the indicator made a lower high), and 5) too many unanswered questions in Europe that may have a downside surprise.
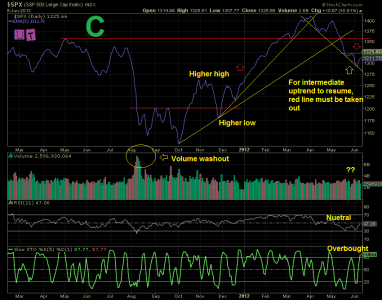
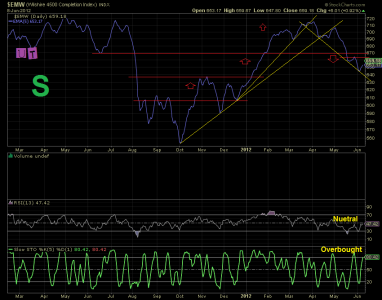
SPX and Wilshire 4500. The trend has been down since April, with three touches of a declining trendline. RSI is neutral, while short term slow stochastic is overbought. So far, there is no higher high. During August of 2011 there was a high volume washout, indicating a reversal in trend. No high volume washout has occurred so far during this downtrend. Wilshire 4500 looks similar (except volume is undefined).
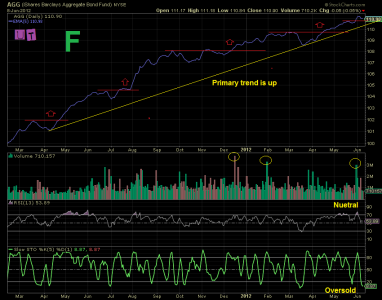
AGG. Bonds have definitely been in an uptrend for some time. We see the cycle of higher highs and higher lows and then a move to new highs past the last momentum high. RSI is neutral and short term slow stochastic is oversold.
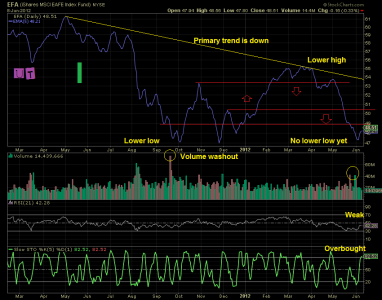
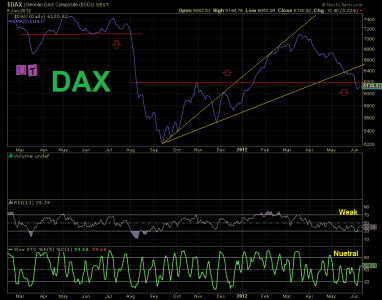
EFA, and German DAX. These charts in a larger context are troublesome. For EFA we see a primary trend that is down. However, the recent low is still above last year’s lower lows. The recent low has been rebounding towards resistance, with a possible volume washout. Could this be the downtrend low, and a turning point for Europe? RSI is weak, and the short term slow stochastic is overbought. That indicates that there should be some short term weakness ahead. DAX has fallen below the momentum high of November, 2011 and needs to regain for a trend reversal.
After looking at all of these charts, I do not see a reversal in trend, yet. For a reversal to occur after a low, we must see a higher high taking out the previous high. A higher low then needs to follow. It just isn’t there. Rather last week’s rally appears to have been working off an extremely oversold condition. Further, the US Dollar (USD) and Euro charts suggest more trouble ahead for equities, as their respective trends show little signs of being finished.
Data to support the bull’s case include: 1) a great start off of support for US equities, 2) some positive divergences; i.e. higher low on RSI while the market was still falling, 3) fairly bearish sentiment, 4) some kind of Europe bailout surprise may unfold, and 4) the primary trend is still up for US equities from the March 2009 low, even though the intermediate trend is down. Data to support the bears case include: 1) no higher high and higher low is in place; either on daily price point extremes or by smoothed moving averages, 2) no high volume washout supporting the notion of a low on most charts (other than EFA), 3) no bottoming process with back and forth price action and high volatility like we saw in August/September, 2011, 4) monthly RSI on SPX and Dow Jones has been carving out a divergence for the last 14 months (price chart made a higher high, while the indicator made a lower high), and 5) too many unanswered questions in Europe that may have a downside surprise.
SPX and Wilshire 4500. The trend has been down since April, with three touches of a declining trendline. RSI is neutral, while short term slow stochastic is overbought. So far, there is no higher high. During August of 2011 there was a high volume washout, indicating a reversal in trend. No high volume washout has occurred so far during this downtrend. Wilshire 4500 looks similar (except volume is undefined).


AGG. Bonds have definitely been in an uptrend for some time. We see the cycle of higher highs and higher lows and then a move to new highs past the last momentum high. RSI is neutral and short term slow stochastic is oversold.

EFA, and German DAX. These charts in a larger context are troublesome. For EFA we see a primary trend that is down. However, the recent low is still above last year’s lower lows. The recent low has been rebounding towards resistance, with a possible volume washout. Could this be the downtrend low, and a turning point for Europe? RSI is weak, and the short term slow stochastic is overbought. That indicates that there should be some short term weakness ahead. DAX has fallen below the momentum high of November, 2011 and needs to regain for a trend reversal.


