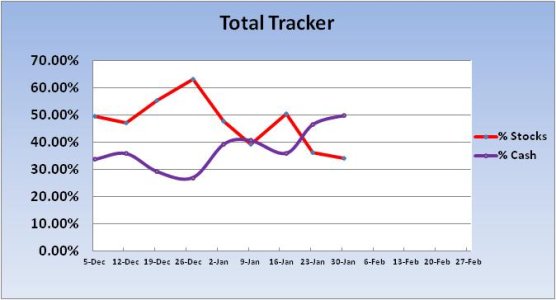
Last week, the Total Tracker showed that we (the herd) collectively had a total stock allocation of just 36.19%. That was the lowest total I had seen in the time I've been tracking this data. I had said that such a low allocation may indicate continued upward pressure on stock prices. Overall, that was the case too. This week, we pulled back a bit more. Can we expect the same results?
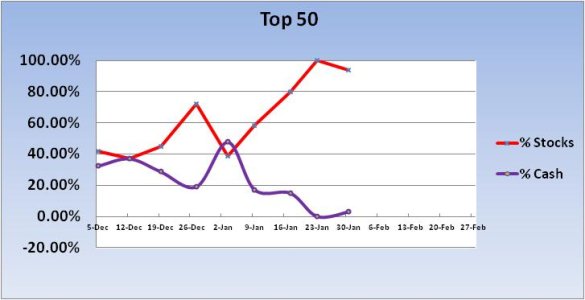
The Top 50 remained largely the same as last week, although there was some measure of profit taking in that group.
Here's the charts:


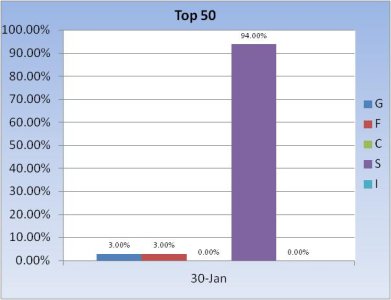
As you can see, the Top 50 remains firmly entrenched in the S fund. And that's been working (so has the I fund if you can time it).


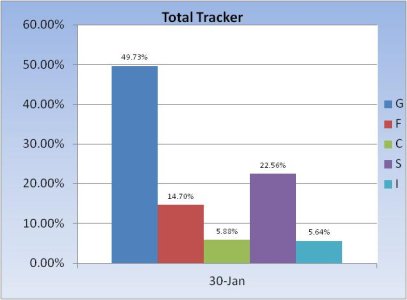
The Total Tracker (the herd) has pulled back their stock allocation a bit more to begin the new week. They reduced their stock allocation by 2.12% to a total of 34.08%. It was already a very low levels last week, so a further reduction may be bullish.
I would like to think we are due for a pullback and there are reasons to support that view, but the market is showing quite a bit of resilience whenever selling pressure does present itself.
Our sentiment survey has been on a buy or hold (buy) now for the past three weeks and it's on a buy again for this coming week. The sentiment survey coupled with our very low stock exposure leads me to think the downside will remain limited. The Seven Sentinels remain in a buy condition too.
I know a few professional trading/investing services that have been warning their subscribers about 2012 for some time now. They are also sporting conservative positions, so our own sentiment survey is hardly alone in it's bearish (bullish) stance. That doesn't mean we can't get some measure of downside action, but I'm not so sure it would amount to anything significant given what I believe is an overall bearish picture. The Top 50 have been positioned perfectly (so far) for the month of January and there's a good chance that what's been working so far will continue to work for the time being.
One thing to watch. February arrives on Wednesday and with it fresh IFTs. Many of us have been sitting on the sidelines because we are out of IFTs. If this market continues its ascent, we could see stock allocations rise in the new month. That could elevate risk levels if that happens so we'll have to watch it carefully.
The Top 50 remained largely the same as last week, although there was some measure of profit taking in that group.
Here's the charts:


As you can see, the Top 50 remains firmly entrenched in the S fund. And that's been working (so has the I fund if you can time it).


The Total Tracker (the herd) has pulled back their stock allocation a bit more to begin the new week. They reduced their stock allocation by 2.12% to a total of 34.08%. It was already a very low levels last week, so a further reduction may be bullish.
I would like to think we are due for a pullback and there are reasons to support that view, but the market is showing quite a bit of resilience whenever selling pressure does present itself.
Our sentiment survey has been on a buy or hold (buy) now for the past three weeks and it's on a buy again for this coming week. The sentiment survey coupled with our very low stock exposure leads me to think the downside will remain limited. The Seven Sentinels remain in a buy condition too.
I know a few professional trading/investing services that have been warning their subscribers about 2012 for some time now. They are also sporting conservative positions, so our own sentiment survey is hardly alone in it's bearish (bullish) stance. That doesn't mean we can't get some measure of downside action, but I'm not so sure it would amount to anything significant given what I believe is an overall bearish picture. The Top 50 have been positioned perfectly (so far) for the month of January and there's a good chance that what's been working so far will continue to work for the time being.
One thing to watch. February arrives on Wednesday and with it fresh IFTs. Many of us have been sitting on the sidelines because we are out of IFTs. If this market continues its ascent, we could see stock allocations rise in the new month. That could elevate risk levels if that happens so we'll have to watch it carefully.
