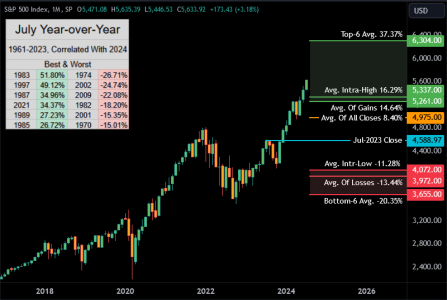
This is not a chart I'd do often but it seems fitting. With yet another 52-week high, this is a good time to take a step back and look the index from a different perspective. This chart is the 63-year statistical range for July-over-July. If we pretended 2024 ends this month, this is where we stand in reference to previous years.
We are currently 22.77% July YoY. This would rank 8th best of 64 years and the 16th highest high.
Monthly SPX

We are currently 22.77% July YoY. This would rank 8th best of 64 years and the 16th highest high.
Monthly SPX

