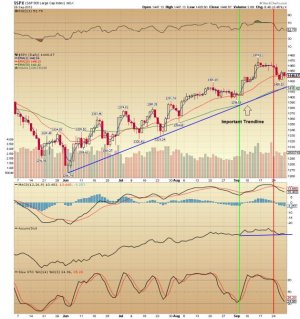
I have been watching the navy blue trendline for weeks. You can see it on the SPX chart below, coming up from the June 4, 1266.74 intraday low and touching the 1329.24 intraday low on day thirty-six, and again on day thrity-seven. This trendline is climbing at the rate of about 1.8 points/day and was crossing 1420 on Friday, September 28. The 50 ema is roughly in the same area at the moment. I was actually expecting a retest of price to this line in early September, when price fell below the 20 ema, but subsequently recovered.
Important trend lines are often retested before advances continue, and I see no reason for a difference this time. A buying opportunity awaits for a market retracement that touches this line, but does not deteriorate into a breach.

Important trend lines are often retested before advances continue, and I see no reason for a difference this time. A buying opportunity awaits for a market retracement that touches this line, but does not deteriorate into a breach.

